Tag Archives: Strava

μ = Sum of Values ÷ Total Number of Values*

Photograph courtesy of Justin Morgan at unsplash.com

I was chatting recently with a friend about bell curves. We were discussing employee performance evaluations. Whether or not to force-fit performance evaluations to a bell curve is a debate that often comes up.

A bell curve is a graphical depiction of a normal distribution. The theory is that the majority of employees should fall into the “Average Performers” category, and 15% to 20% of employees should fall into either the “Low Performers” category or the “High Performers” category.

Graph courtesy of updconsulting.com

This morning, I clicked on a link for a post titled Strava Year In Sport Trend Report: Insights on the World of Exercise. The post summarised average speed and distance data for cycling activities uploaded to Strava between October 1, 2022 and September 30, 2023. I wondered where I fell on the bell curve of cycling performance as tracked by Strava.

The post lists average cycling speed and distance by age.

There is very little difference in average speed across the four age categories. Just half a kilometre per hour separates Gen Z at 20.8 kph and Millennials and Boomers at 20.3 kph. Gen X averaged 20.6 kph.

Interestingly, Boomers had the longest rides, averaging 33.6 km per ride. Millennials had the shortest, at 22.2 km per ride. Perhaps we retired Boomers have more time to devote to cycling.

I am on the right-hand side of the bell curve for both average cycling speed and average distance per ride. For the population of cyclists posting on Strava, anyway. As a Boomer, that is a blessing.

* μ (mu) represents the average or mean of a particular sample.

A 14-Year Cycling Summary

Strava and other activity tracking apps send out personalised annual activity summaries. My 2023 Strava cycling summary shows a bit of an uptick since a steady decline starting in 2018.

I took a look back at my cycling history as recorded on Strava. The chart below shows the year-on-year increase or decrease for total distance, total elevation, number of rides and average distance per ride for each year from 2010 to 2023.

The numbers show overall high and low totals in the relevant year.

Data courtesy of Strava, RWGPS and VeloViewer

I started cycling in September 2009. Just after starting a new job in Houston. This post explains why I started cycling:  

The first ride I recorded on Strava was in Houston on 31st January 2010. By then I had graduated from my first bike, a Trek 7.5 FX hybrid, to a custom-built steel road bike from Alchemy Bicycle Company.

This post is about the process of getting that road bike: 

My last ride in Houston was in April 2010. My next ride was in June 2010, on a rental bike while I was waiting for my Alchemy to arrive in my new home in The Netherlands.

This post describes that first Dutch ride: 

The Netherlands now has 33,000km of dedicated cycling paths. I covered 9,787km exploring those paths in 2012. It helped that I had a lot of time to cycle because I wasn’t working while I was in the Netherlands.

This post describes some of the aids to navigating that vast network of bike paths: 

I miss those bike paths to this day.

My last Dutch ride was in September 2012. I had my first ride in Malaysia two weeks later, thanks to having air-freighted my bicycles home to Kuala Lumpur.

That ride was courtesy of a former colleague who introduced me to her cyclist brother. He linked me up with the Racun Cycling Gang:  

I started working full-time again in 2013, so I couldn’t ride whenever I wanted. What my new Malaysian riding buddies and I were doing was cycling on Tuesday and Thursday nights. Nevertheless, I rode less in 2013 than I had in 2012. What did increase that year was the metres climbed. There are more hills around Kuala Lumpur than around Houston and Den Haag!

2014 saw my mileage fall to 3,198km. I did 59 rides, a third of what I did in 2012. I don’t remember why, but we did fewer Tuesday and Thursday night rides. I think marriages and births had something to do with it.

The major reason for the decline in 2014 was my crash in May:  

That kept me off my bike for more than three months.

Regular service resumed in 2015. I rode 10,096km, including five imperial century (160km or more) rides and twenty-one other rides of more than 100km. That started a five-year streak of cycling 10,000km or more per year.

2015 was also the year when I did my first cycling vacation:  

There are seven posts about my Cognoscenti adventure. You can read the following posts by clicking on the link or the arrow above and to the right of the post title.

The upward trend continued in 2016 and 2017. 2016 was when I had my longest ride. 445km in 27 hours:

2017 was the year I rode the furthest, the most often, and climbed the most. The year began with a 301km ride on New Year’s Day. By the end of the year, I had completed sixty metric century (100km or more) rides.

I rode more than 10,000km in 2018 and 2019. Including completing the Rapha Festive 500. A streak of Festive 500s that started in 2016.

2020 marks the start of the COVID-19 Restricted Movement Orders in Malaysia. Despite only doing 24 rides in five months, I rode enough in the other months to rack up 152 rides for the year. That included an Audax 300 ride in August.

Map courtesy of RWGPS

But 2020 was the start of a decline in annual mileage.

As you can see from the graph at the top of this post, my mileage fell in 2021 and 2022. I did 151 rides in 2021, which is a surprise as I had seven weeks off the bike after knee surgery. Despite doing just one less ride than I did the previous year, the average distance per ride fell. I covered 1,763km less than in 2020.

There were 99 rides in 2022. I was in Colombia for six months, where I cycled once.

I did manage to complete another Rapha Festive 500, though.

2023 started with the 115km Audax Pink Ride 6.0.

Photograph courtesy of Audax Randonneurs Malaysia

I had 41 more rides in 2023 than I had in 2022. But again, the average distance per ride was lower. This time by 10km. Despite riding more often, my total distance was just 650km more than my 2022 distance.

Hopefully, 2024 will bring another uptick in the total distance covered. The 120km Audax Pink Ride 7.0 is on the cards!

Image courtesy of Audax Randonneurs Malaysia

That will be my first metric century ride since the Pink Ride 6.0.

The Strava Effect

Strava Banner

Graphic courtesy of Road Bike Culture

There is no doubt that Strava has driven the phenomenon of social cycling, and sociable competition.  Millions of cyclists track and share their rides on the Strava website.  And in doing so, many strive to better their times on each ride, thereby hopefully outdoing their friends on a favorite sector, or even claiming a coveted King of Mountain or Queen of Mountain crown.

How many millions exactly?  With secrecy typical of a Silicon Valley start-up, Strava does not disclose precisely how many users it has, preferring to say that it has “tens of millions”, with a million joining every 40 days.  Wikipedia reports that as of March 2015 there were an estimated 1 million active Strava users.  Extrapolating from Strava’s own estimate of the rate at which people join, there are about 126 million active users today.

Not bad for a company which was founded in 2009.

Rapha festive500 Banner

Graphic courtesy of 2wheelchick.blogspot.my

Companies selling cycling-related products have noticed the ever-increasing popularity of Strava, and are using the app to connect with existing and potential customers.  One such company is Rapha.  In 2010 Rapha launched the #Festive500, an event in which participants challenged themselves to ride 500km / 311mi between Christmas Eve and New Years’s Eve.  That year there were 84 participants.

In 2011 Rapha started offering woven fabric roundels to everyone who successfully completed the #Festive500 challenge.  Strava was an obvious partner because their app made it easy for participants to record their rides and track their progress, and for Rapha to manage the challenge, from sign up to verification that participants had successfully completed the challenge.

Rapha Patches

Roundels courtesy of Rapha

To say that this partnership is a success is an understatement.  The modest number of  #Festive500 participants, 84 in 2010, had mushroomed to 83,130 in 2017.

Rapha Feastive 500 (1)

Data courtesy of Strava and Rapha

There were 19,120 successful finishers for the 2017 Rapha #Festive500.  That is a lot of roundels for Rapha to ship out.  Each one creating a link between Rapha and a cyclist.

In recent years Rapha has capitalised on the increasing popularity of the #Festive500 by offering prizes for the best #Festive500 stories.  The 2017 prizes included a Rapha Travel trip and Leica D-Lux camera, a 3T Exploro Team road bike, a Wahoo Bolt GPS Bundle, and a Wahoo Kickr Snap turbo trainer.  The winning entries can be seen here.

In 2017, the year-on-year growth in #Festive500 participants leveled off.  Perhaps because of the very cold winter in the northern hemisphere.  That has not deterred the folks at Rapha.  They have already asked roadies to make the #Festive500 their end of year challenge for 2018.

I wonder what the 2018 roundel will look like?

Cycling Infographics

Infographics make complex information eye catching, shareable and easily digestible.  The best ones combine eye-catching graphics with interesting facts.

For example, A World of Languages.  Did you know that 146 living languages are used as a first language in Malaysia?

2017 Infographic 7 Alberto Lucas López www lucasinfografia com

Graphic courtesy of Alberto Lucas López

Unsurprisingly, there are lots of infographics to do with cycling.  This one plots the increase in the number of riders who completed the Rapha Festive 500 between 2011 and 2014.

2017 Infographic 3

Graphic courtesy of Rapha

For 2017, the number of roundel winners is above 19,000.

More details about the 2012 and 2013 Festive 500s are presented in these infographics.

Some activity-tracking sites produce individualised infographics.  Strava is perhaps the most popular online cyclists’ community, with 203 million rides logged in 2017.

Each cyclist using Strava can generate a movie summarising their own achievements in 2017.  The closing graphic looks like this.

2017 Strava My Year in Sport

Graphic courtesy of Strava

Strava also lets members generate heatmaps showing where they have ridden during a user-selected time period.  The color used highlight the routes changes from blue through purple to red, depending on how often that particular route has been ridden.

2017 Strava Heatmap

Map courtesy of Strava

Third parties can access Strava’s data to produce their own infographics.  This is the heatmap produced by Jonathan O”Keeffe’s Strava Multiple Ride Mapper application.  It improves on the native Strava heatmap by using a wider range of colors to indicate ride frequency.

Veloviewer.com is another third-party application that pulls data from Strava to create individualized infographics.

One is a variation on the heatmap, supplemented with the date, distance, and elevation of each of the rides within the user-selected date range.

2017 Veloviewer Wheel

Graphic courtesy of Veloviewer

The more popular Veloviewer infographic, especially at year-end, is the one which tracks a variety of measures through the year.

2017 Veloviewer

Graphic courtesy of Veloviewer

Madewithsisu.com uses your Strava data to produce art, rather than infographics in the strict sense of the word.

Like Veloviewer, the user selects the time period from which data is to be used.  Clocked represents each of your activities as a ring. They start when you started and finish when you finished.

The Multi-Route plots the route of all your rides for the chosen time period.

If you are interested in more infographics about cycling, like this one . . .

2017 Science of Suffering

Graphic courtesy of Velopedia: The Infographic Book of Cycling

or this one . . .

2017 Hour Record

Graphic courtesy of Velopedia: The Infographic Book of Cycling

then Velopedia:  The Infographic Book of Cycling is the book for you.

The Art of Exercise

I enjoy studying graphic representations of data.  Like this map illustrating 59,036 routes between 3,209 airports on 531 airlines spanning the globe.

Sisu openflights org

Graphic courtesy of openflights.org

And this chart showing our galaxy’s relative size and position within the known universe.

Sisu Galaxy national geographic com

Graphic courtesy of nationalgeographic.com

The latest graphic to pique my interest is one created by Sisu.

Sisu Logo

Sisu takes your exercise data from Strava or Runkeeper, and turns that data into a print.  Sisu has been around since at least 2014.  Co-founder Peter Roome posted the first blog entry on the Sisu website in May that year.

I found out about Sisu last week, when cycling friends started posting their Sisu prints on Facebook.

There are a few designs to choose from on the Sisu website.  I like their original design that displays all the routes you covered between your chosen start and finish dates.  The plots of each route are sized so all of them fit on one page.  Thus the plots are not to scale.

Below are the routes I rode in 2010, the year I started cycling.  The first four rows show rides within and around Houston, Texas.  The rest of the routes are either loops or out-and-back rides starting from Den Haag, The Netherlands.  I moved from Houston to Den Haag in May 2010.

The rides range from 14.5km / 9mi (row two, far right, which was a short run from my Houston home to Hermann Park and back), to 124.5km / 77mi (row six, third from the left, which was from my Den Haag home to Kinderdijk and back).

Sisu 2010

Graphic courtesy of madewithsisu.com

Even with only fifty rides in 2010, patterns emerge from the plots.  Most of my Houston rides were with the West End 6:30 group.  We rode a consistent route through the city every Tuesday and Thursday.  Most of those are shown on row three.

Den Haag is just a couple of kilometers from the coast.  You can’t ride very far west before you run into the North Sea.  So a lot of my rides in The Netherlands followed the coastline, either south-west or north- east from Den Haag.

As you lengthen the timeline, the Sisu plots of each route get smaller.  To ensure that, in this case, 885 routes fit on one page.

This print shows my entire Strava ride history.

Sisu 2010 to 170318

Graphic courtesy of madewithsisu.com

I think this print is a fascinating way to review my cycling history.  It is obvious from the graphic that my Kuala Lumpur friends and I spent an awful lot of time on the KESAS Highway in 2013 and 2014, as shown by all the horizontal, slightly squiggly routes in the middle third of the print.

There was a time when the Bukit Damansara route was popular.  This route Bukit Damansaraappears a dozen times in the centre rows.

Highlights stand out too.

An evening’s ride around the Sepang International Circuit produced this plot Sisu Sepang.  It is not too difficult to find, about two-thirds of the way down the print.

More difficult to pick out is this route, my longest ever ride at 445km / 276.5mi Sisu BRM400.  It is in the fourth row from the bottom.

Of course, what my Facebook friends and I should be doing is paying Sisu for a print.

Sisu Order

Prints come on 300 grams per square meter Matt Photorag stock.  300gsm paper stock is at the higher end of paper thickness.

The print size is 12 inches by 16 inches for US orders, and A3 size (297mm by 420mm) for orders from the rest of the world.  The price for a physical print, or a digital download, are above.

I’m thinking of a present to myself when I hit 60,112km / 37,351mi.  That is 1.5 times around the circumference of the Earth.  Which should be in two months or so.

Watch Where You Went

Relive Where Did You Go

Cycling GPS units, also called cyclocomputers, from manufacturers like Garmin, CatEyeLezyzne, Sigma Sport, Wahoo Fitness, PolarMagellan and others have become ubiquitous.  Almost every road cyclist I see has a GPS unit on their handlebar, or on their wrist.

Those that do not often rely instead on a GPS app from the likes of Strava, Cyclemeter, Ride With GPS, Map My Ride, or Endomondo, running on a mobile phone.

Not many of us use our cyclocomputers or mobile phones to navigate whilst riding, although units with mapping capability are invaluable when you get lost.  Instead we use these devices to keep a record of where we have been, when, and how fast we rode.

As soon as we can after a ride, we download the ride data from our cyclocomputers to a website like Strava, Garmin Connect, or Ride With GPS.  Those using mobile phone apps or a wireless capable cyclocomputer just wait for their devices to do the uploads automatically.

Strava is very popular ride tracking site.  Cyclists log into to Strava to look at ride statistics.  What was our average speed?  How much climbing did we do?  Did we set any PRs?  Did we bag any KOMs?  Shown together with the ride statistics is a map overlaid with the route we just rode.

Relive Strava Map Screen

Screen Capture courtesy of Strava

An exciting newcomer to the ride visualization scene is Relive.cc. 

Relive Splash Screen

Rather than just displaying a static map of your ride, Relive.cc takes the ride data from your Strava account and creates a movie of your ride.  This is the Relive movie of my ride last weekend.

Much more interesting to look at than the Strava map above.

If I had attached geotagged photographs to my Strava ride record, those photographs will have displayed at the appropriate spots in the movie.

Now that I have linked my Strava account to Relive.cc, I get movies of my rides within an hour of uploading my ride data.

You’ll be seeing more of those movies in my ride reports from now on.  For “reliving” your rides, this app is

Relive Cool

Graphic courtesy of designyoutrust.com


Calling All Strava Geeks

Strava Logo

“My greatest fear in life is forgetting to turn on Strava.”

“If it’s not on Strava, it didn’t happen.”

I’m not as fanatical about Strava as those who subscribe to these quotes may be.  Close though.

All my rides are saved on Strava.  Most of my riding buddies use Strava too.  There is something quite satisfying about reviewing ride metrics on Strava.  Not to mention completing challenges and winning trophies.  Even if those trophies are just icons on your profile.

And I am a Premium Member.  Which unlocks additional goodies like the Suffer Score, and Filtered Leaderboards.

I’ve recently discovered more Strava goodies.  Courtesy of Strava Labs.

The millions of activities uploaded to Strava have created a dataset of nearly a trillion GPS data points.  Strava Labs showcases interesting projects that use this dataset.

Projects like The Roster, which visually analyses your athletic social habits, total group activities and your preferred training partners.  In my case, ranging from someone I have ridden with 111 times, to the person I rode together with only once.

Or The Global Heatmap, which answers the question “What do 220,000,000,000 data points look like?”

The data points for Malaysia produce this heatmap.

Heatmap courtesy of Strava Labs

Heatmap courtesy of Strava Labs

The global heatmap is zoomable.  This is the center of Kuala Lumpur at maximum zoom.

Heatmap courtesy of Strava Labs

Heatmap courtesy of Strava Labs

Then there is The Clusterer.  This project creates a map that is searchable by distance and activity type.  This map shows the four most popular ride routes around Kuala Lumpur.

Heatmap courtesy of Strava Labs

Heatmap courtesy of Strava Labs

Clockwise from top right are Genting Sempah to Janda Baik, Hulu Langat, KESAS and Guthrie Corridor to LATAR.  The small loop in the center is the OCBC Cycle Malaysia 2014 route, which was saved to Strava by 190 people.

The KESAS Night Ride, by contrast, clusters 1,830 rides.

Heatmap courtesy of Strava Labs

Heatmap courtesy of Strava Labs

There are more projects listed on the Strava Labs homepage.  There is also a link to a blog where you can read about Strava’s technology, culture and latest projects.  And if you fancy developing your own project, the Developers link takes you to a comprehensive portal for information about the Strava API.

Enough to keep a Strava geek occupied for days.

An Abridged History

Posted on

June has been a quiet month for riding.  The weather, weekend travel, illness and idleness have all kept me off my bikes.  I started 2015 with aspirations to average 1,000km a month.  So far I am 150km per month short of that goal.  Nevertheless 2015 is shaping up to be one of my better years for cycling.

I consider my first day as an avid cyclist to be Sunday January 31st, 2010.  That was the day Big Bill B guided me on a 53km loop around Houston, including a food stop at Carter & Cooley Company Delicatessen in The Heights.

It was the first time I rode with a Garmin cycling computer on my handlebar, which allowed me to commit this and all future rides to that collective memory that is the internet.  I am a bit of a ride data geek.  I started feeding that habit with Garmin Connect.  After a few years I supplemented that with Ride With GPS, and very soon after Strava was added to the mix.  Lately Veloviewer has joined the party.

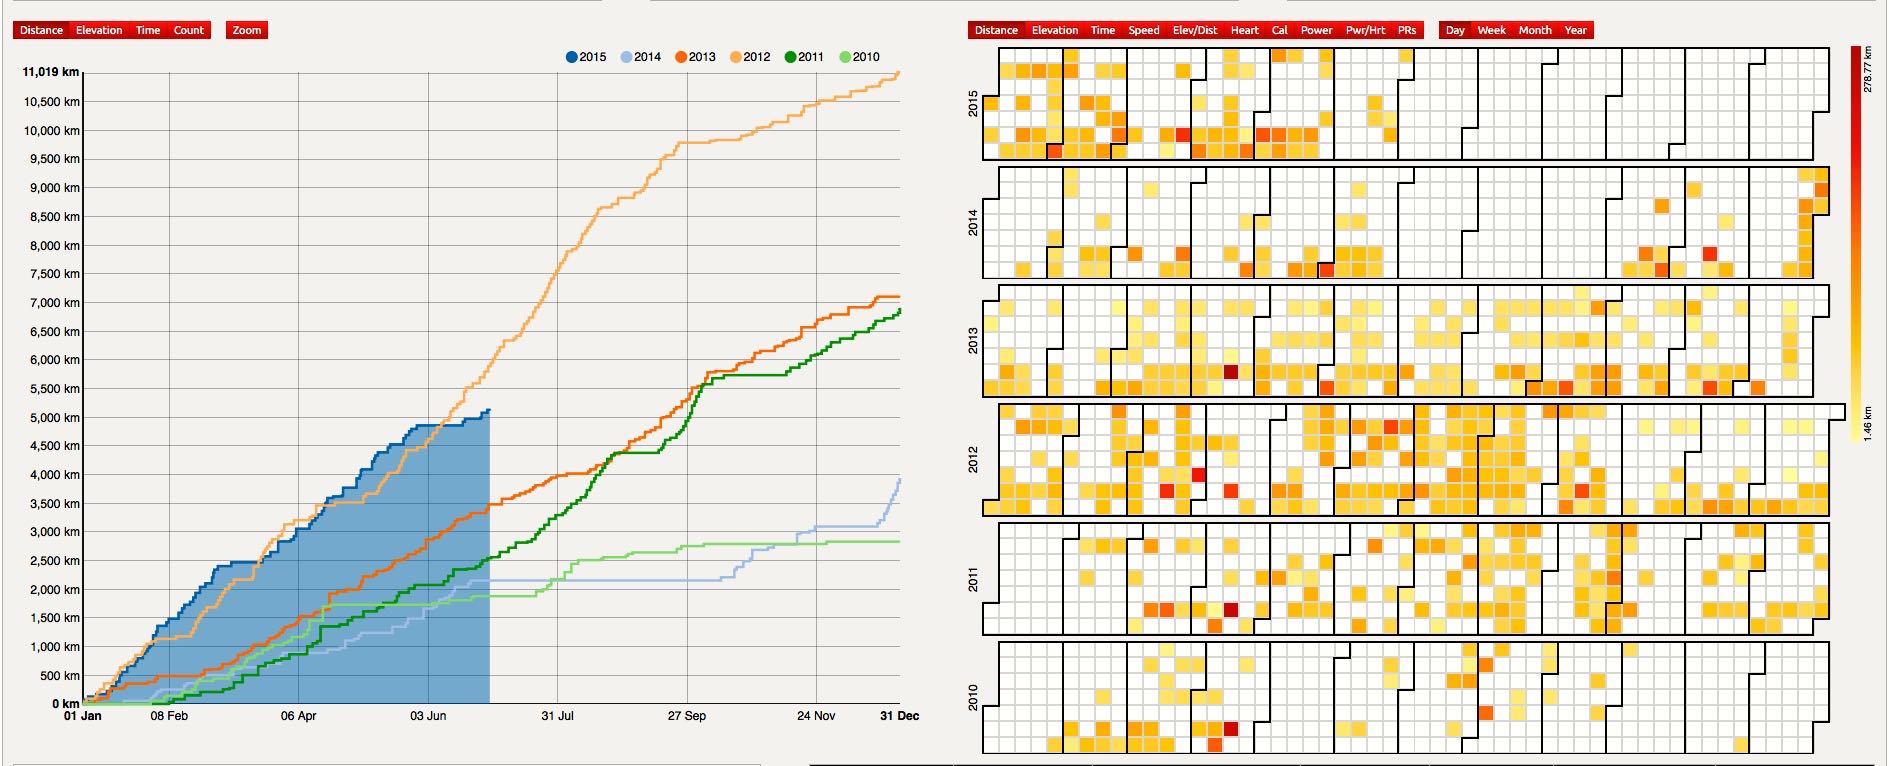
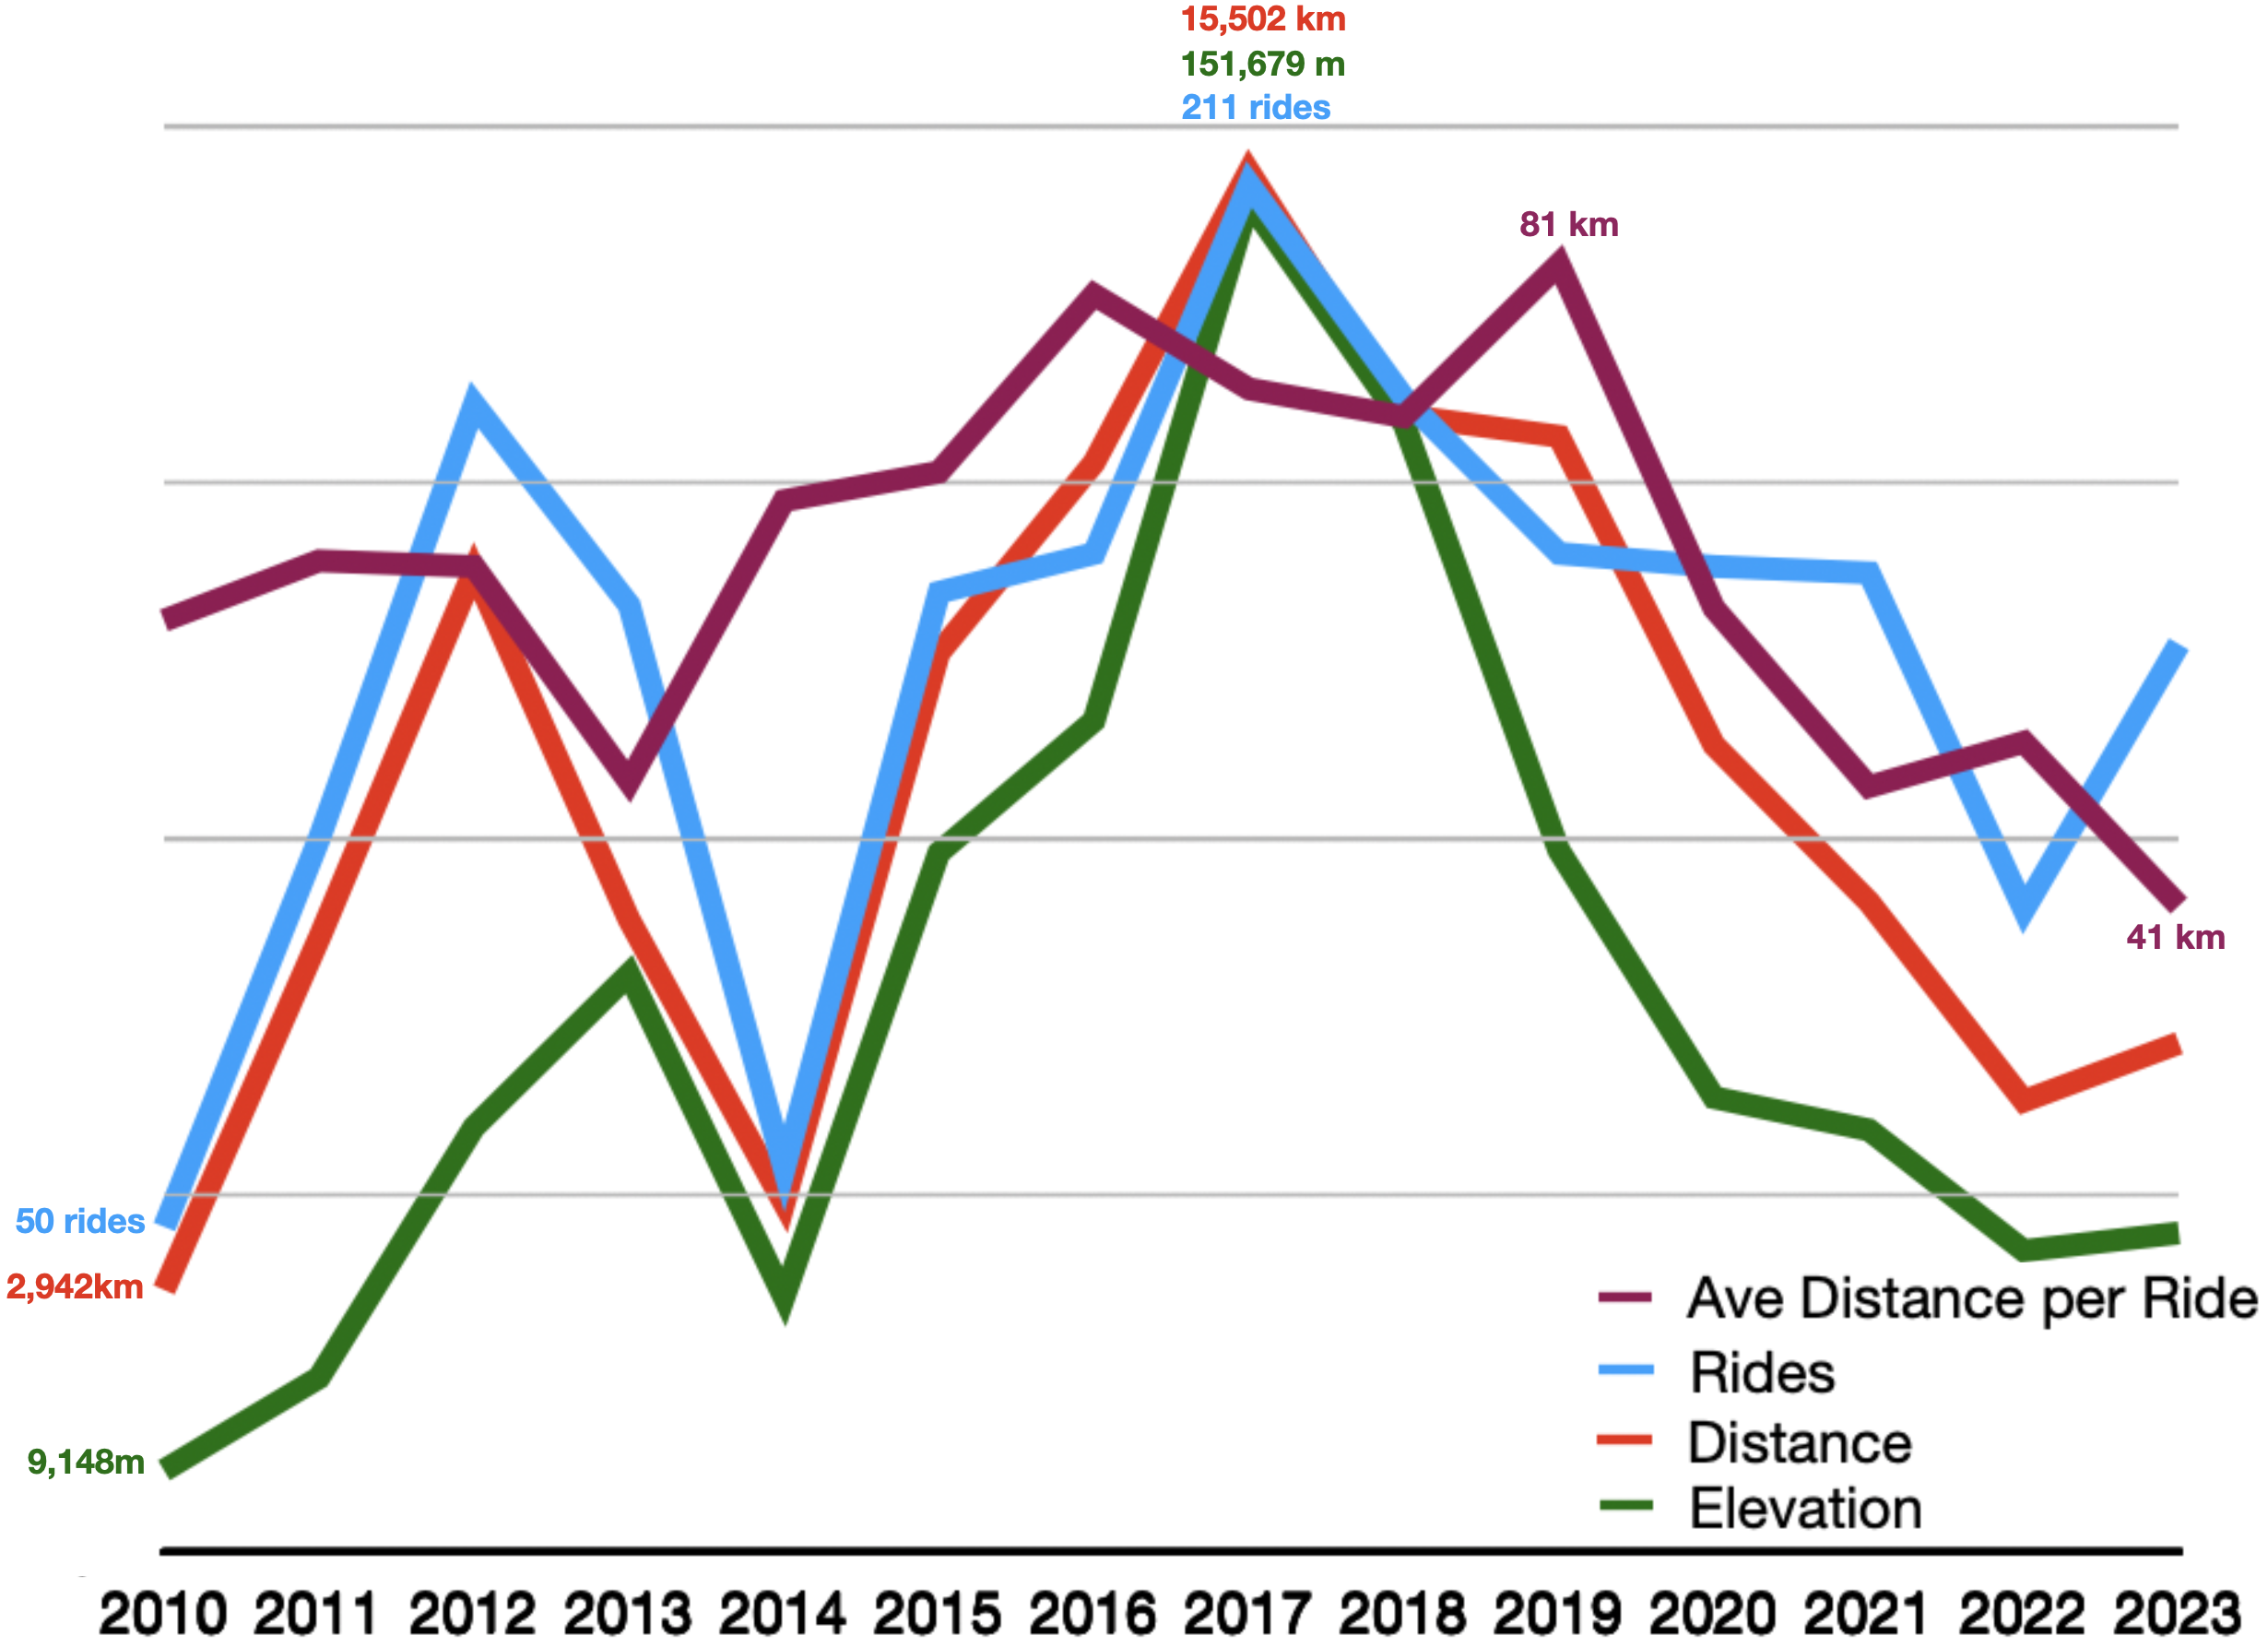
Why so many tracking apps?  In my case, mostly because they each provide different ways to view my ride data.  Ride With GPS provides nice summaries by month or year.  I can see what my buddies have been up to in Strava.  Veloviewer makes annual comparisons easy.  Charts like these ones provide the grist for this post.

Charts courtesy of Veloviewer

Charts courtesy of Veloviewer

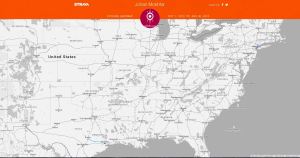
Between January and the end of April 2010 I rode in and around Houston.  Those rides included my first century ride, The Space Race, and my first BP MS150.

Heat Map courtesy of Strava

Heat Map courtesy of Strava

My biker chick had started her new job in Den Haag, The Netherlands, in April.  So my bike spent May in a container, along with our other possessions, on a ship bound for Europe.

I spent the rest of the year exploring the bike paths around Den Haag.

I logged 2,831kms in 2010.  My average ride distance was 59kms.  My average ride time was 2 hours 28 minutes.

In 2011 my total distance covered jumped to 6,886kms.  My average distance went up slightly to 63kms.  The average ride length went up in tandem to 2 hours 33 minutes.

Much of that increase in total distance ridden is testament to the outstanding cycling infrastructure in The Netherlands.  You can’t help but get on your bicycle in a country where the riding in so safe, convenient, and scenic.

In 2012 my mileage again jumped significantly over the previous year.  To 11,019kms.  The average distance stayed almost the same at 62.25kms.  I picked up speed though, with my rides averaging 2 hours 29 minutes.

Heat map courtesy of Strava

Heat map courtesy of Strava

Almost all of my riding over these two years was in The Netherlands.  I did occasionally venture further afield.  I made my first extended cycling trip in 2011.  I went to Ninove in Belgium, to ride in the Ronde van Vlaanderen sportif.

In 2012 I did the Ronde van Vlaanderen again, which started and ended this time in Oudernaarde.  I also took two trips to Maastricht, for the UCI World Championships and the Amstel Gold sportifs.

Heat map courtesy of Strava

Heat map courtesy of Strava

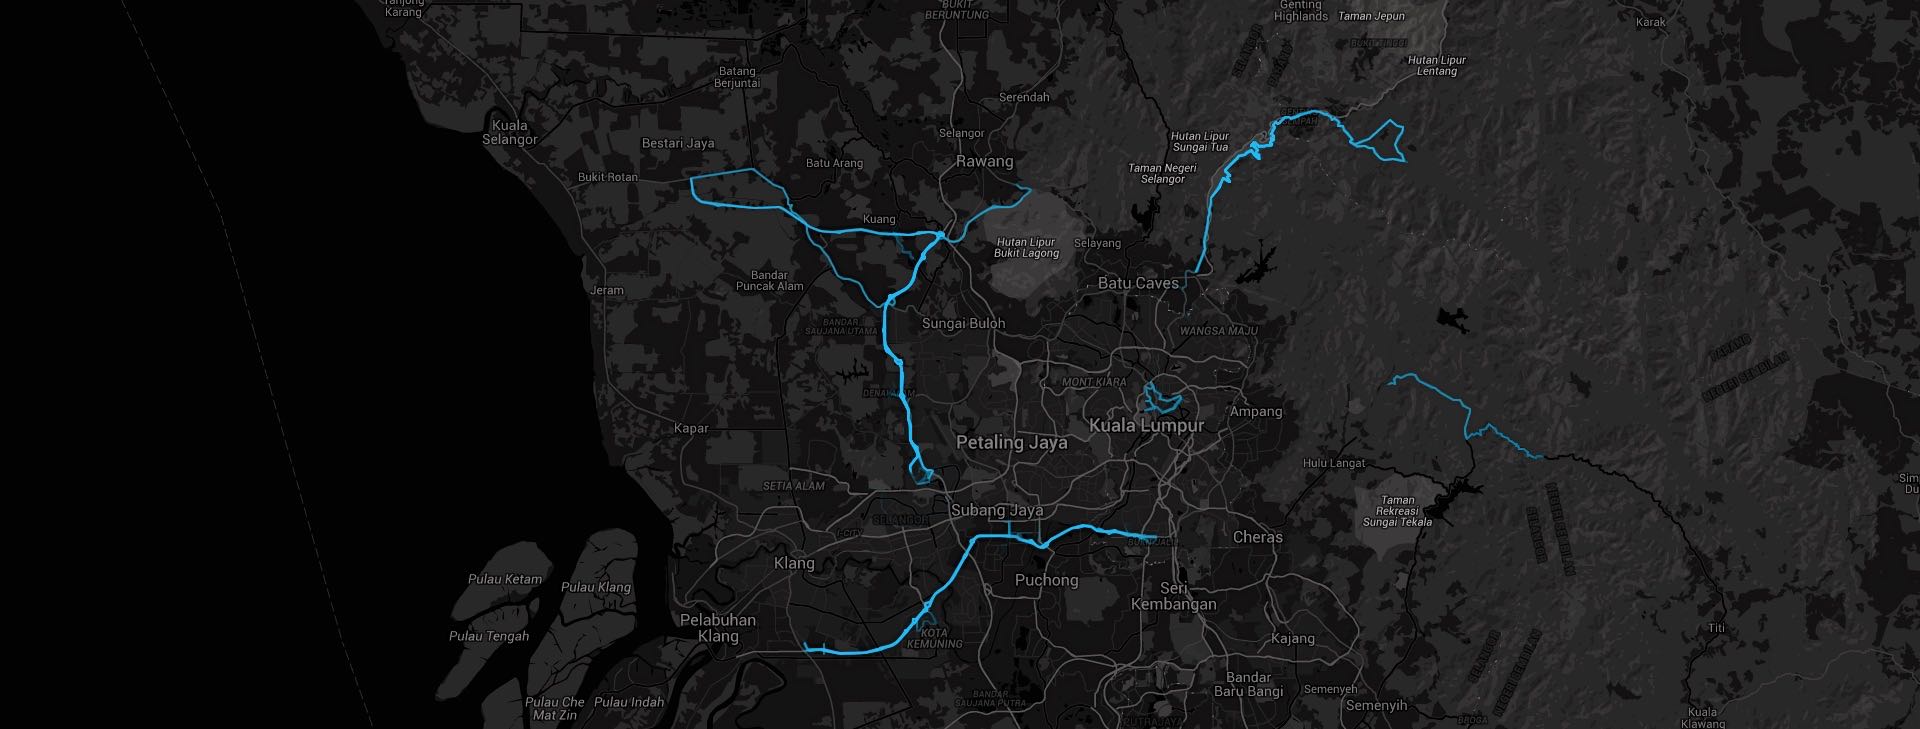
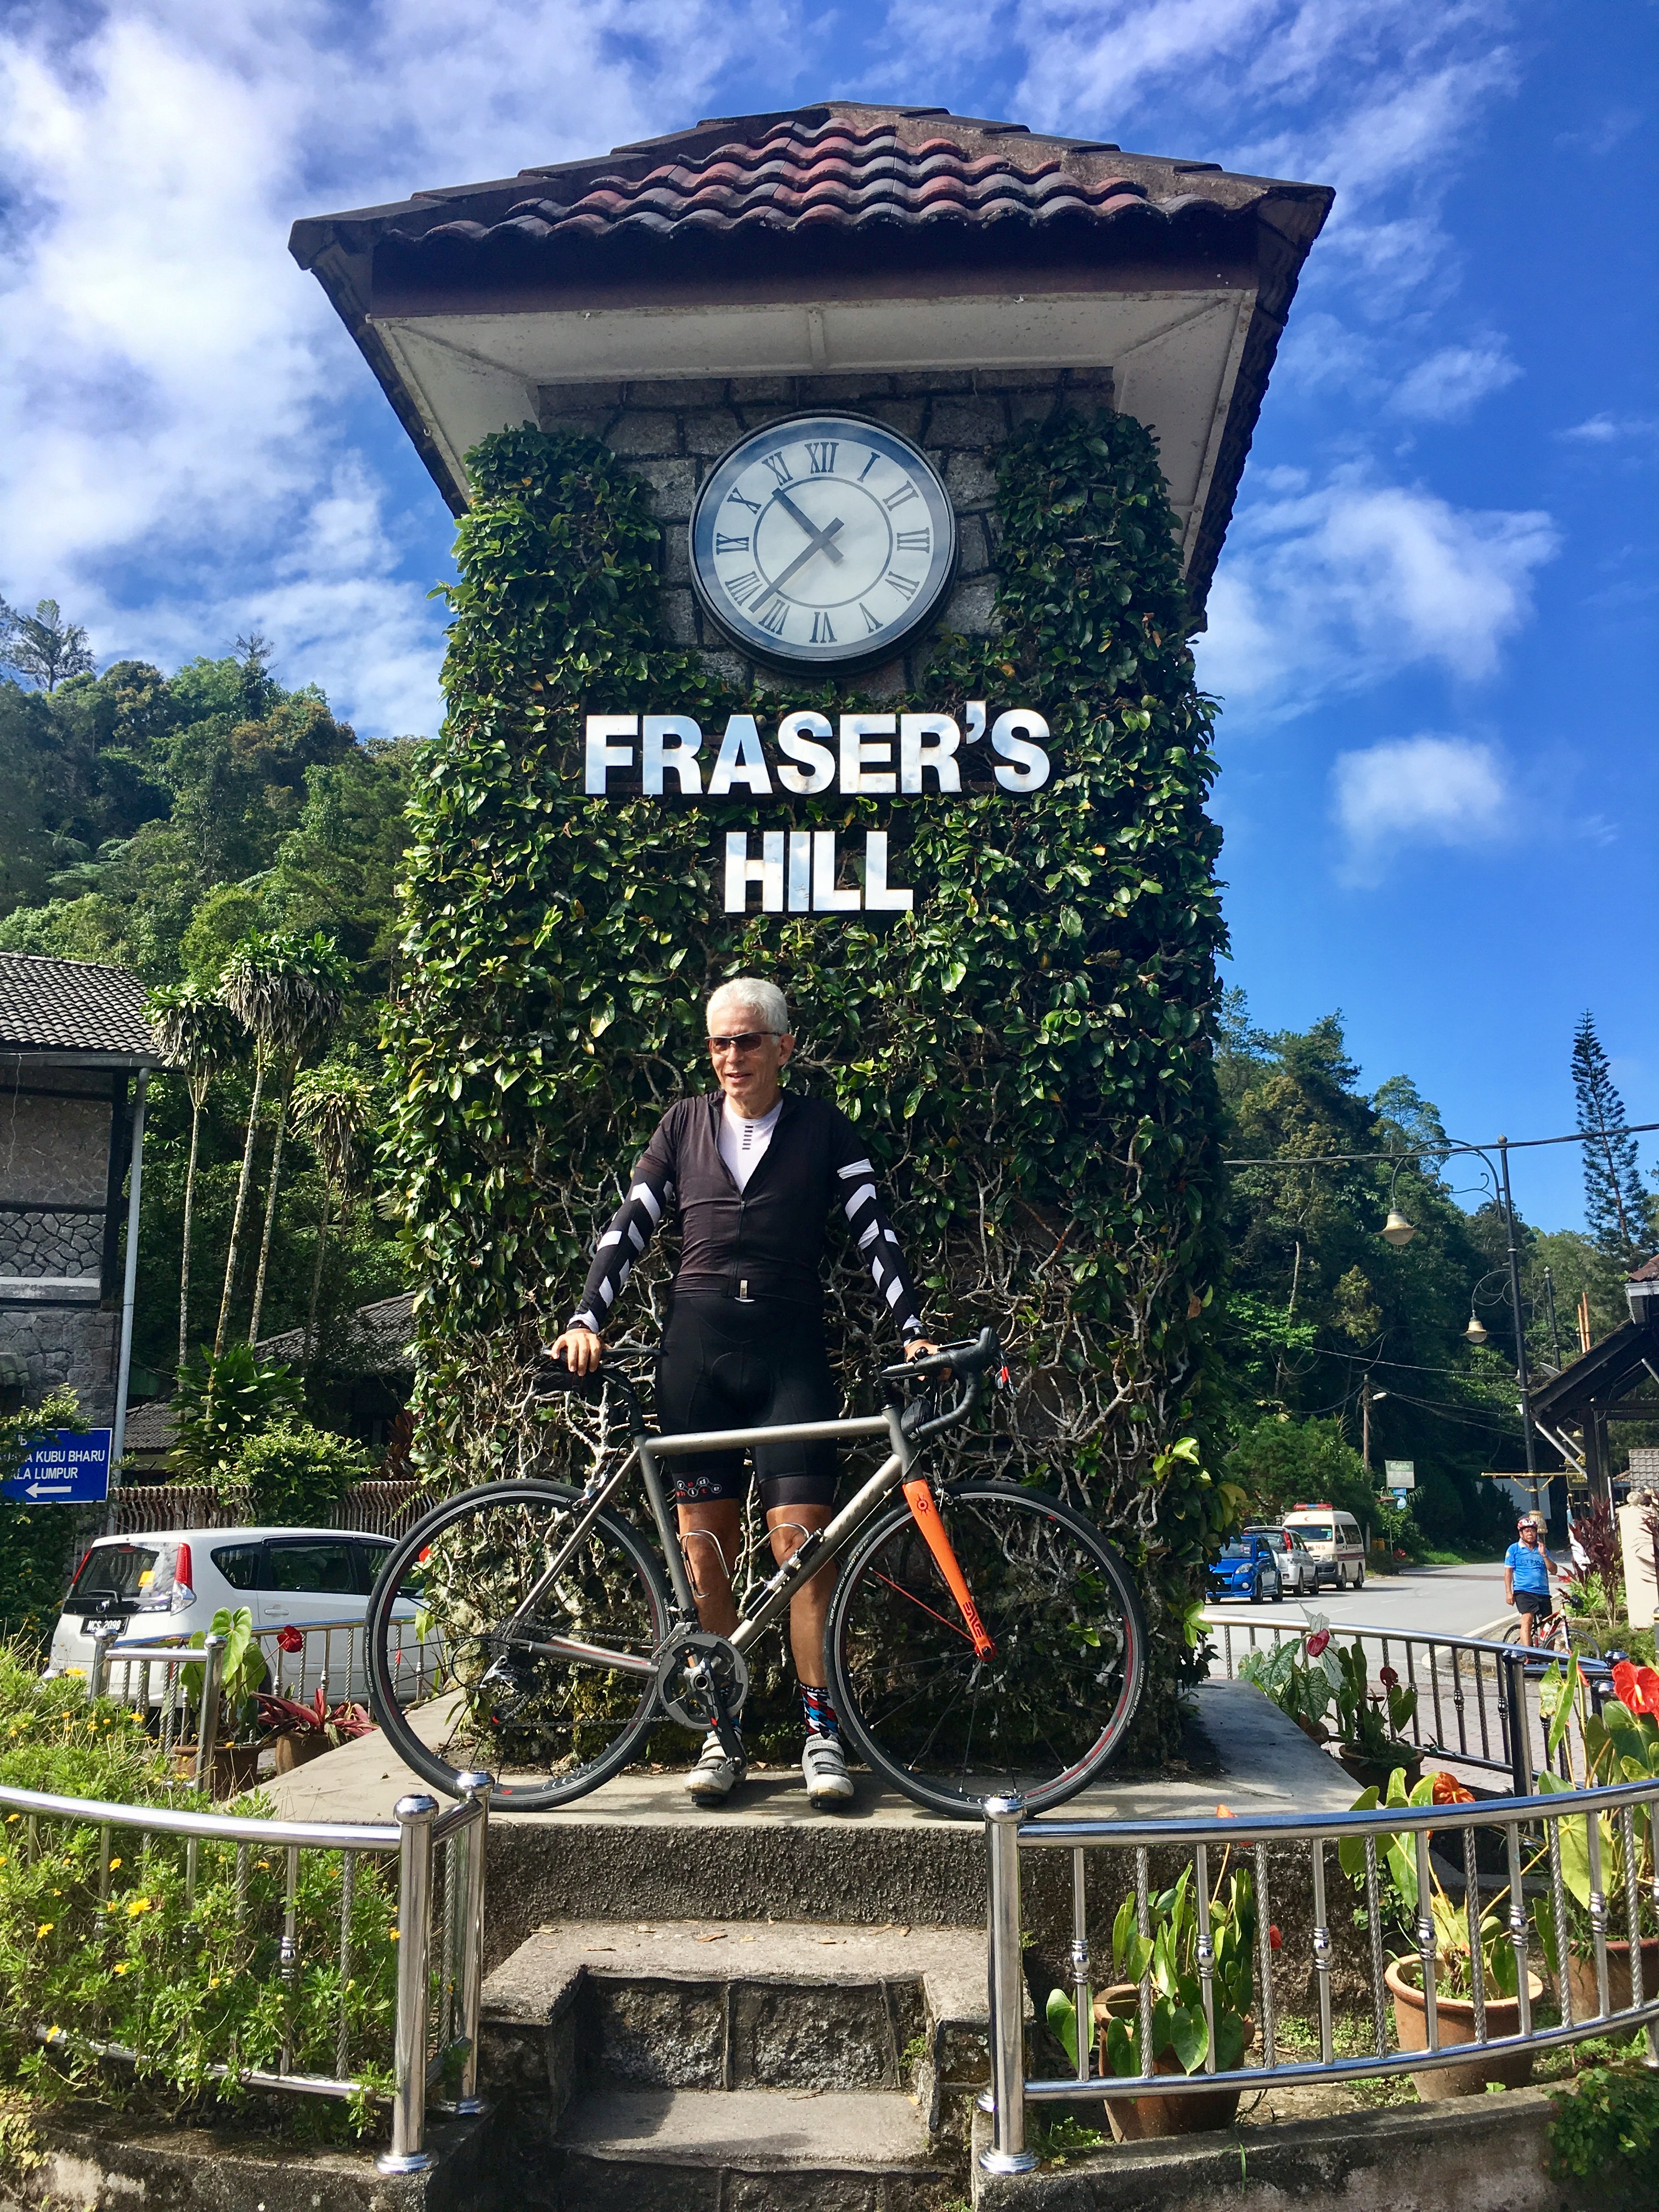
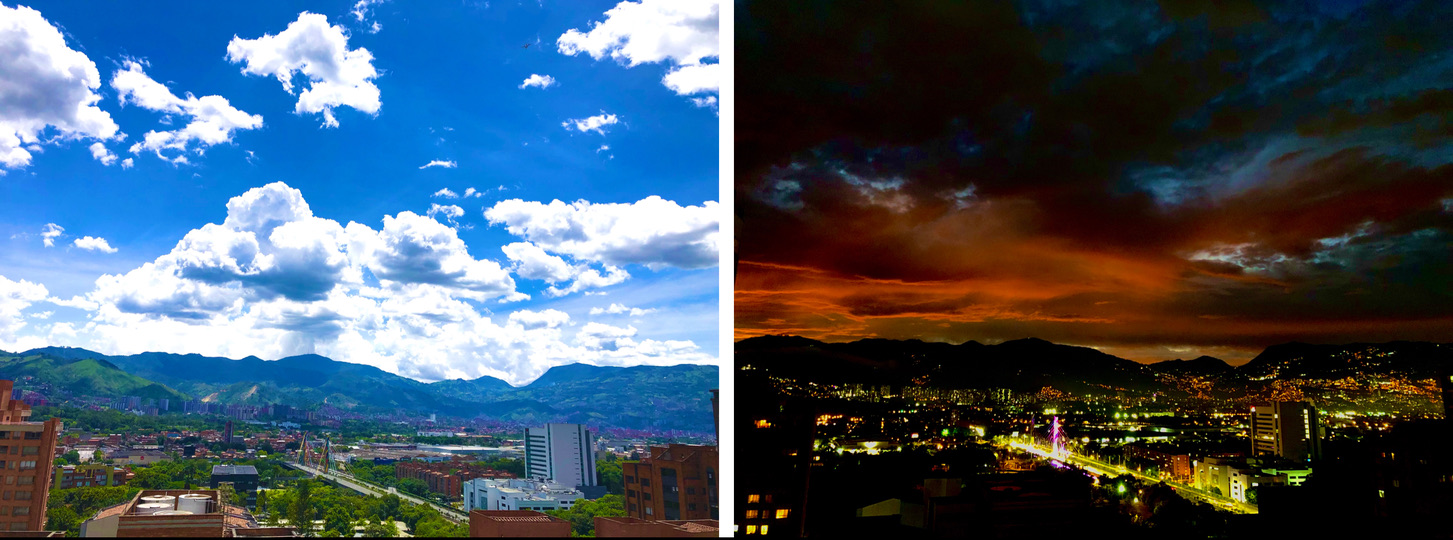
In October 2012 my biker chick and I returned to Kuala Lumpur.  My bikes (by this time I had two) followed soon after by air freight.  So it wasn’t long before I was immersing myself in the relatively new and booming road cycling scene in Malaysia.

Cycling in Kuala Lumpur reminds me a lot of cycling in Houston.  You share the roads with traffic.  Sometimes a lot of traffic.  City riding is best done at night, when the roads, or motorcycle lanes where provided, are quieter.  The popular daytime cycling routes are mostly outside the city.

In 2013 I started venturing further afield.  Century rides in various cities around the country become a regular activity, including one international road trip to Hatyai in Thailand.

Despite the number of century rides, my mileage in 2013 was only 7,102kms.  My rides had become shorter, averaging 49kms and 1 hour 58 minutes per ride.  I remember that tropical rainstorms had a lot to do with curtailing riding time in 2013.

The downward trend continued in 2014.  I had four months of enforced time off my bikes because of a crash, and two unrelated surgeries.  Those breaks from cycling resulted in only 3,918kms ridden.  My average ride was surprisingly long though, at 66kms and 2 hours 35 minutes.

Heat map courtesy of Strava

Heat map courtesy of Strava

Almost all of my cycling since the end of 2012 has been in Malaysia.  The exceptions were in 2013, when I flew to the United States to ride in the BP MS150 from Houston to Austin, and to ride in the 5 Boros Ride in New York City.  In between those rides I visited an old friend in Denver, where  I managed to squeeze in a few rides as well.  I came home with bicycle number three.

Heat Map courtesy of Strava

Heat Map courtesy of Strava

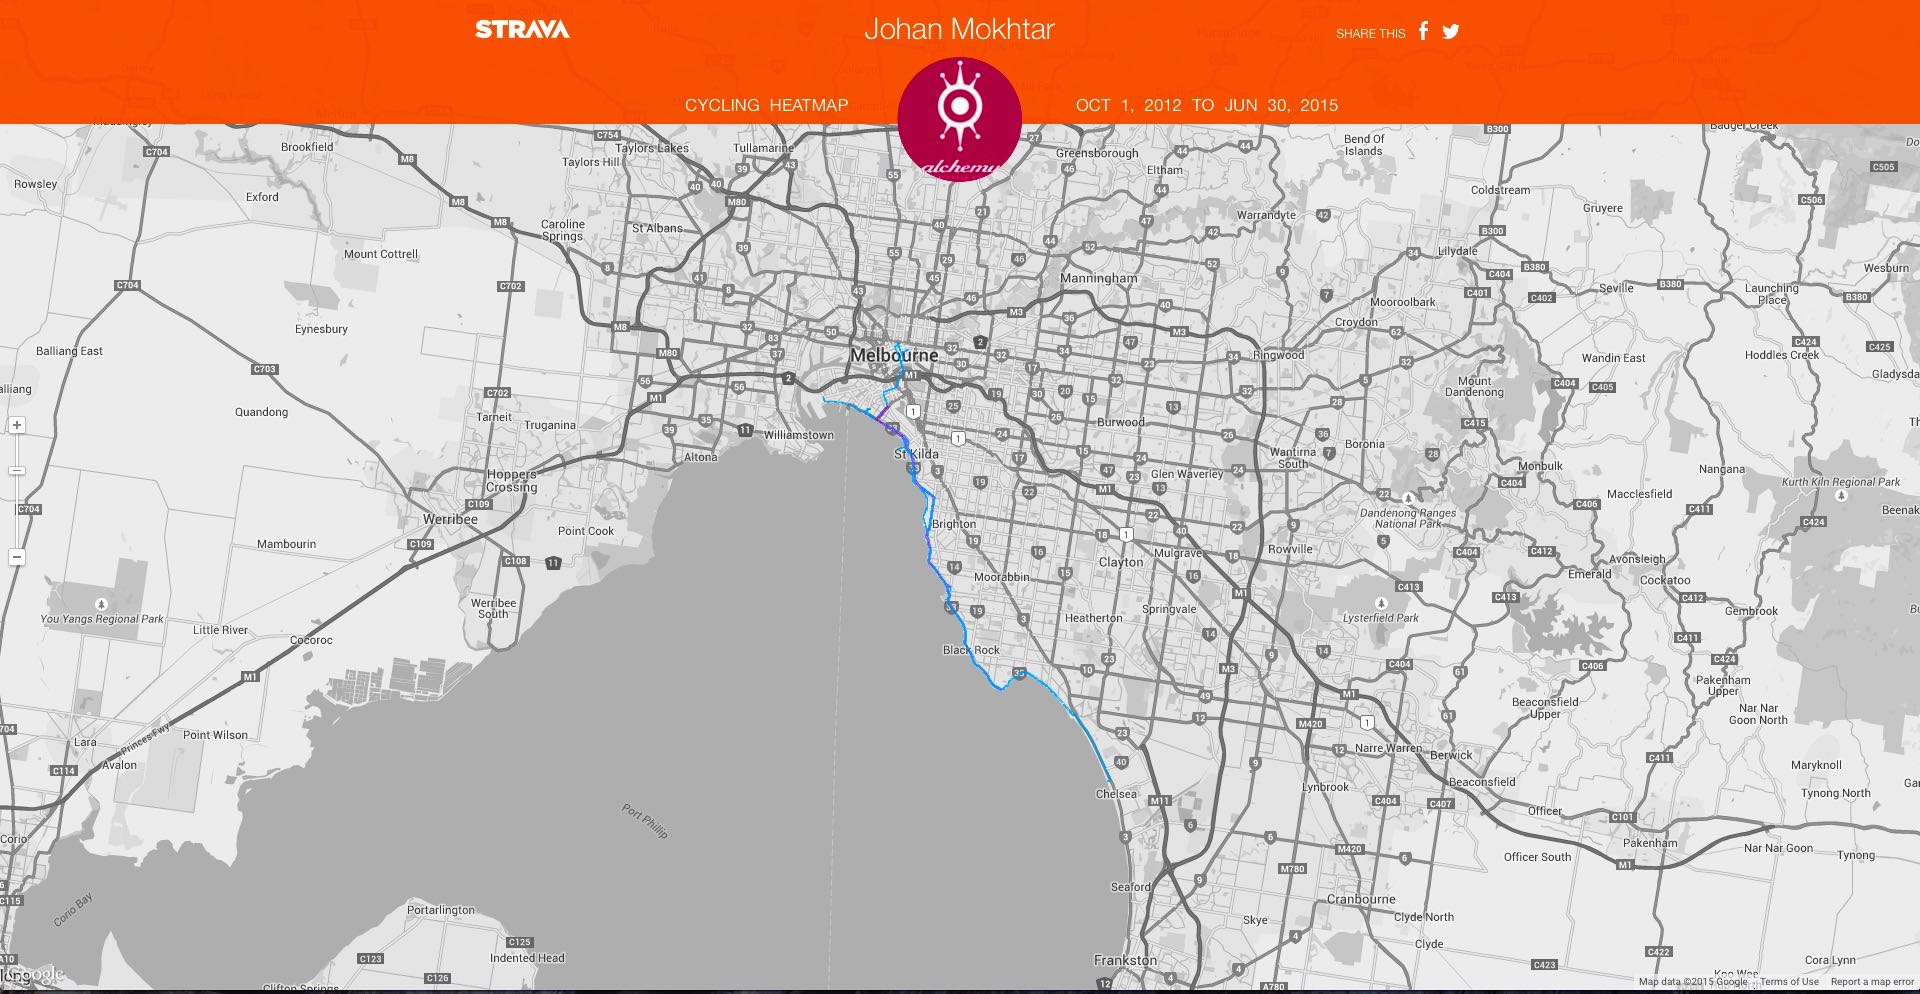
That bicycle is a Ritchey Breakaway.  It came with me to Melbourne in December 2013.  My last cycling trip away from home to date.

Heat map courtesy of Strave

Heat map courtesy of Strava

2015 looks good so far.  I am up to 5,078kms as at the end of June.  My average ride length for the year is 71kms.  I must be a bit fitter than I was last year too.  I am riding on average 5kms further this year as compared to last, but my average time is the saddle is only 3 minutes more, at 2 hours 38 minutes.

I’m hoping to take at least one cycling trip outside Malaysia this year.  And I am looking forward to staying healthy and spending as much time as possible riding.

JFK Quote 3

LifeBEAM Smart Helmet

LifeBEAM Banner

Regular readers know that I am a fan of gadgets.  If it is a cycling gadget, I am truly hooked.

I read some reviews of the LifeBEAM helmet.  The technology intrigued me.  Optical sensors read pulse signals directly from the forehead, and state of the art algorithms then remove ‘motion-generated noise’, process all the data in real time and send accurate heart rate numbers to a mobile device.

The prospect of no longer having a heart rate monitor strapped to my chest appealed to me.   The fact that this technology was initially developed by LifeBEAM to monitor the vital signs of pilots and astronauts only added to it’s appeal.  I logged on to the LifeBeam site, invoked that financial facilitator known as Paypal, and ordered a helmet.

The helmet arrived with a few extras.  A cloth carrying bag, and this carry on carbon case.  Most unusual for a cycling helmet was of course the micro USB charging cable.

LifeBEAM Case

The optical sensor and electronics module are built into a Lazer Genesis helmet.  From the side the helmet looks like any other unmodified Lazer Genesis, apart from the discreet LifeBEAM logo.

LifeBEAM Side

The view from the rear reveals the dark grey electronics module, including a triangular light-grey flap that covers the micro USB charging port, and the blue status light.  Barely visible below the status light is the power button.

LifeBEAM Rear

The optical sensor is inside the front edge of the helmet, surrounded by a gel pad.

Photograph courtesy of DCRainmaker.com

Photograph courtesy of DCRainmaker.com

The optical sensor must be resting against the skin of your forehead, not too tight or too loose.  If you wear a helmet liner or a skull cap, it must not obstruct with the sensor. You will have to find the sweet spot where the helmet fits comfortably and the heart rate is being displayed.

Animation courtesy of LifeBeam

Animation courtesy of LifeBeam

The helmet comes with both ANT+ and Bluetooth 4.0 connectivity.  So it will pair with all Garmin devices, as well as Suunto, Timex, and other ANT+ enabled watches.  On the Bluetooth side the helmet will pair with mobile phones, and is therefore usable with the slew of iOS and Android cycling, running and general fitness apps.

Initial setup was simple.  Charge the battery, turn on the electronics, and pair the helmet with your device of choice.

On my Garmin Edge 705 I went into the Settings > ANT+Sport > Accessories menu and selected Restart Scan.  The Edge 705 picked up the transmission from the helmet in seconds.

Photograph courtesy of Lowcadence.com

Photograph courtesy of Lowcadence.com

The Lazer Genesis is a comfortable and well-ventilated helmet.  The fit is easily adjusted with Lazer’s Rollsys retention system.  The optical sensor is unnoticeable.  Wearing the LifeBEAM Smart helmet is like wearing any other helmet.  The only difference being the added 40g / 1.4oz weight of the electronics.  And that it transmits my heart rate to my Edge 705.

This helmet does exactly what I had hoped it would.  I can track my heart rate data, (essential for generating Strava Suffer Scores), without wearing a chest strap.  There is no discernible difference between the heart rates transmitted from the helmet and those from my chest strap mounted heart rate monitor.  And “yes” the helmet is more comfortable than the chest strap.

The helmet comes with one other useful extra that chest straps do not offer.  Lazer have developed an LED light that fits inside the Rollsys thumb wheel.  You turn the light on and off, and switch between constant and flashing modes, by pushing on the clear lens cover.

Photograph courtesy of Bikerumor.com

Photograph courtesy of Bikerumor.com

I unreservedly recommend the LifeBEAM Smart helmet.  Both for the excellent integration of optical sensor technology into a cycling helmet, and for the outstanding customer support I received when I had a problem with my helmet.

The first helmet I received worked impeccably on rides of less than two hours or so.  But on longer rides the helmet would either stop transmitting to my Edge 705, flat line at some arbitrary heart rate, or it would transmit erratic heart rate data.

An email to LifeBEAM support produced a quick response.  Over the next few weeks a regular exchange ensued as the support team troubleshot the problem.  They looked at Strava data files from my longer rides, and conducted some diagnostic tests during a Skype chat session.

Despite the best efforts of the support team, the helmet continued to behave erratically on longer rides.  The suspect was a faulty optical sensor.  So LifeBEAM quickly did what all customers would expect when equipment malfunctions right out of the box.  They provided a replacement helmet, free of charge.

My replacement helmet arrived two weeks ago.  It has performed faultlessly, no matter how long the ride.  The optical sensor has been unaffected by rain, and the copious amounts of sweat off my forehead.

The LifeBeam Smart helmet is a winner.

LifeBEAM logo

An Epic Ride – Though I Would Have Preferred it Wasn’t

Strava displays a “Suffer Score” along with other summary information about each ride that you upload.  The Suffer Score is a value calculated using your heart rate during a ride relative to your maximum heart rate, and the distance ridden.  The higher your Suffer Score, the harder you worked during that ride.

A descriptor is assigned to Suffer Scores.  100 to 150 is a Tough score.  151 to 250 is an Extreme score.  Anything greater than 250 is an Epic score.

I have only twice had a Suffer Score in the Epic category.  The first was during the Kuantan Century Ride last year.  My average speed was 28 kph.  My average heart rate during that ride was 144 bpm, over a distance of 161 km.  I felt trashed for the last 20 kms of that ride.

My second Epic effort was yesterday.  I rode with four other Flipsiders from Bandar Sunway to Morib and back.  This ride was  133km.  My average speed was 26.6 kph.  Despite the shorter distance and lower average speed, my heart rate averaged 140 bpm.  Not much less than it was during the Kuantan ride.  And again I felt trashed for the last 20 kms of the ride.

I have had rides that had a lot more climbing, and were therefore more difficult  – although this wasn’t easy either, given that the sun was beating down and that the temperature felt like 36 °Celsius.

I suffered, despite the flatness of the Morib ride, due to an alarming lack of fitness.  I knew that being inactive for more than three months would have a negative effect, but I didn’t expect it to be this bad.

The route took us west along the KESAS Highway.  It was my first time riding west of Sunway Lagoon, though my companions have done this ride before.

We exited the KESAS Highway at the Bandar Botanik interchange, where we turned left onto Jalan Langat.  I have been on that section of road before, during the ride to Port Dickson, and during the Klang Premiere Century ride.

Morib

We weren’t on Jalan Langat very long before we had to make a stop at a PETRONAS petrol station.  Justin had a flat tire.  I took the opportunity to take an opportunistic photograph.

Photograph courtesy of Mark Lim

Photograph courtesy of Mark Lim

We had stopped at the PETRONAS Johan Setia.

Two hours into the ride my left arm and shoulder had started aching.  I spent a lot of time sitting up on my saddle to give my arm and shoulder a rest.  Marco is smiling in his selfie, but you can see that Mark and I are wilting in the heat.  At this point we had another fifteen kilometers to go before we got to Morib.  Those were some of the longest kilometers I have ever ridden.

Photograph courtesy of Marco Lai

Photograph courtesy of Marco Lai

It was a relief to finally arrive at Taman Seri Bayou Morib.  Marked on the beach side by this pretty art installation.

Morib Sculpture

We had ridden 75 kilometers.  There were serious doubts in my mind that I would make it all the way back to Sunway.

I didn’t look it at the time, but I did feel somewhat rejuvenated after these.

Morib Dutch Lady

Four cartons of cold chocolate milk.

The others looked cheery while waiting for their nasi lemak.  I had some too.  It was very good.

Morib Makan

It was about 11.00am when we started the return leg.  This wasn’t the last sit-down I needed before we got back to Bandar Sunway.

Morib Sign

The return leg was 17 kms shorter than the outbound leg.  We had done a loop to the east of Bandar Sunway at the start.  Despite the shorter homeward distance, my average speed dropped from 27.6 kph to 25.5 kph.  Even with the slower pace, my average heart rate went up from 137 bpm to 145 bpm.  That must be when my Suffer Score ventured into Epic territory.

I really was struggling over the last 20 kms.  I kept looking at my Garmin, convinced that I had covered three or four kilometers since the last time I checked it.  Only to find that I was only fifteen hundred meters further forward.  Right about the time I was going to pack it in and collapse on the edge of the road, a rest area hove into view.  There was only about 6 kms to go, but I wouldn’t have made it without that final fifteen minute rest in the air-conditioned PETRONAS shop – and without an ice-cream.

I would have preferred an easier ride.  Especially after such a long time off the bike.  It does however make me believe that I will finish the Malacca Century Ride next Sunday.

Hopefully it won’t be another Epic!