Tag Archives: Edge 705

Garmin Edge 1050

Photograph courtesy of garmin.com

I started using a Garmin Edge cycling computer in 2010. My Edge 705 served me well until 2016, when I upgraded to an Edge 1000. A design fault with the power button made me retire the Edge 1000 and start using an Edge 1030 in February 2018. A crash in July 2024 snapped one of the tabs on the quarter-turn mount interface on the underside of my Edge 1030. You can read about that adventure by clicking here.

I continued to use the 1030 despite it popping off the out-front mount whenever I hit a bump. The screen damage incurred during the same crash worsened progressively over the next two months. My son got me a good deal on an Edge 1050 in September 2024.

I very much like the Edge 1050.

Each generation has progressively gotten larger and heavier. Interestingly, each generation is thinner than the previous one, which illustrates the increasing miniaturisation of components. The ever-larger width and height are due to the display size nearly doubling from the Edge 705 to the Edge 1030/1050.

The key improvements of the Edge 1050 over the Edge 1030 are the increased screen resolution and the switch from a transflective LCD to a transmissive LCD with a screen brightness of 1,000 nits. The Edge 1050 has a bright, high-resolution touch screen with more vivid colours.

Specification Edge 705Edge 1000Edge 1030Edge 1050
Physical Dimensions (W × H × D)51mm × 109mm × 25mm58mm × 112mm × 20mm58mm × 114mm × 19mm60.2mm × 118.5mm × 16.3mm
Display Size (Diagonal)5.6 cm7.6 cm8.9 cm8.9 cm
Display Resolution
(Pixels)
176 × 220240 × 400282 × 470480 × 800
Weight104g 114.5g124g161g

There are also improvements inside the Edge 1050. Hardware changes include a much faster processor that delivers a smoother, more smartphone-like experience when scrolling, zooming maps, and navigating menus. The inclusion of Multi-band GNSS offers more precise tracking and positional accuracy. The basic beeper in previous devices has been replaced by a built-in speaker with an electronic bell and audio prompts.

Software improvements let you download and update maps via WiFi on the device and make contactless payments. There are hazard alerts and improved group-ride features. Lastly, the User Interface has been redesigned and is more responsive.

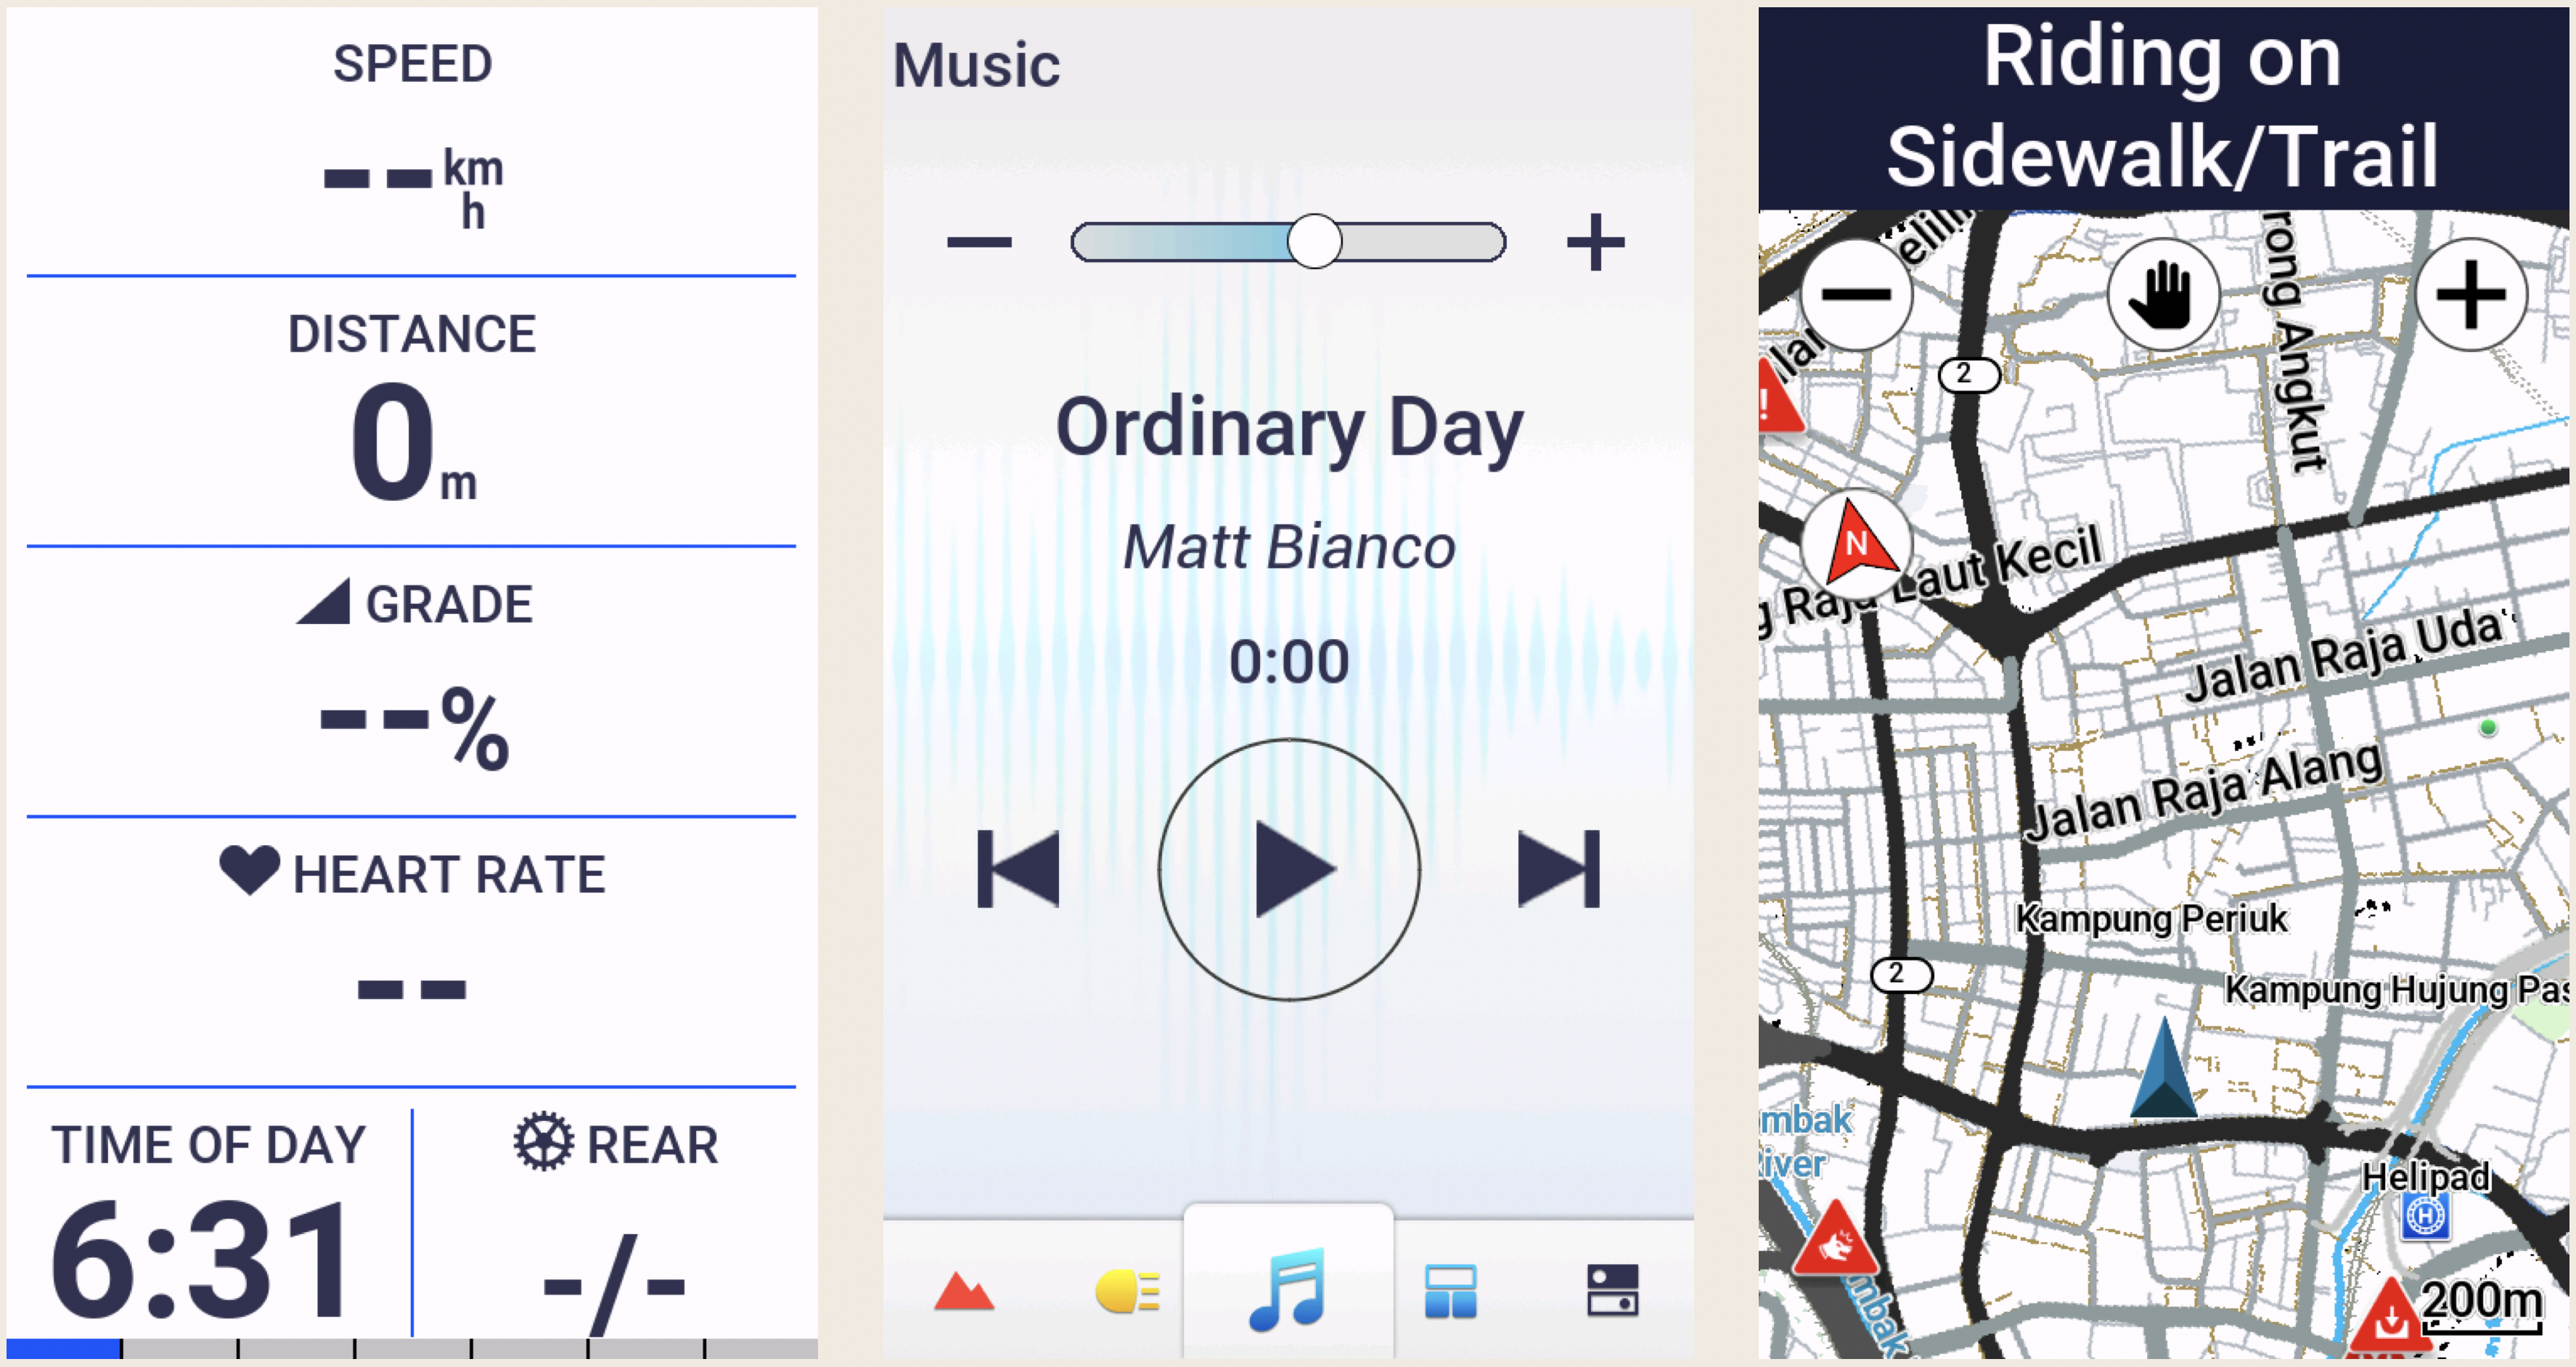
I progress through these three screens at the start of every ride. On the left is the Home screen that usually displays after the device has booted up.

In the centre is the Status widget screen. Widgets provide at-a-glance information like weather and notifications. Swiping down from the Home screen reveals the Widget screen. I usually turn on my Edge 1050 inside a car park. I use the Widget screen to confirm that my Edge 1050 has acquired a GPS satellite signal.

Touching the light icon at the bottom of the Widget screen reveals the Light screen. I control my Garmin Varia UT800 front light from the Light screen.

Swiping up from any Widget screen returns the display to the Home screen. From the Home screen, I can start a ride by touching the large ROAD activity profile button, start navigating by touching the NAVIGATION button, or access the system settings by touching the MENU button.

Touching the ROAD activity profile button goes to the data screen on the left below. Data screens, widget screens and activity profiles are all easily customisable. I have customised this screen to show the data fields I use the most.

I swipe left from my preferred data screen to reveal the Music screen. I ride with Shokz bone conduction headphones. The open-ear design lets me listen to music and navigation prompts without drowning out or masking the sounds around me. I can still hear a vehicle approaching me from behind and be in conversations while using the headohones.

I use the Music screen to control which track is playing and to adjust the playback volume.

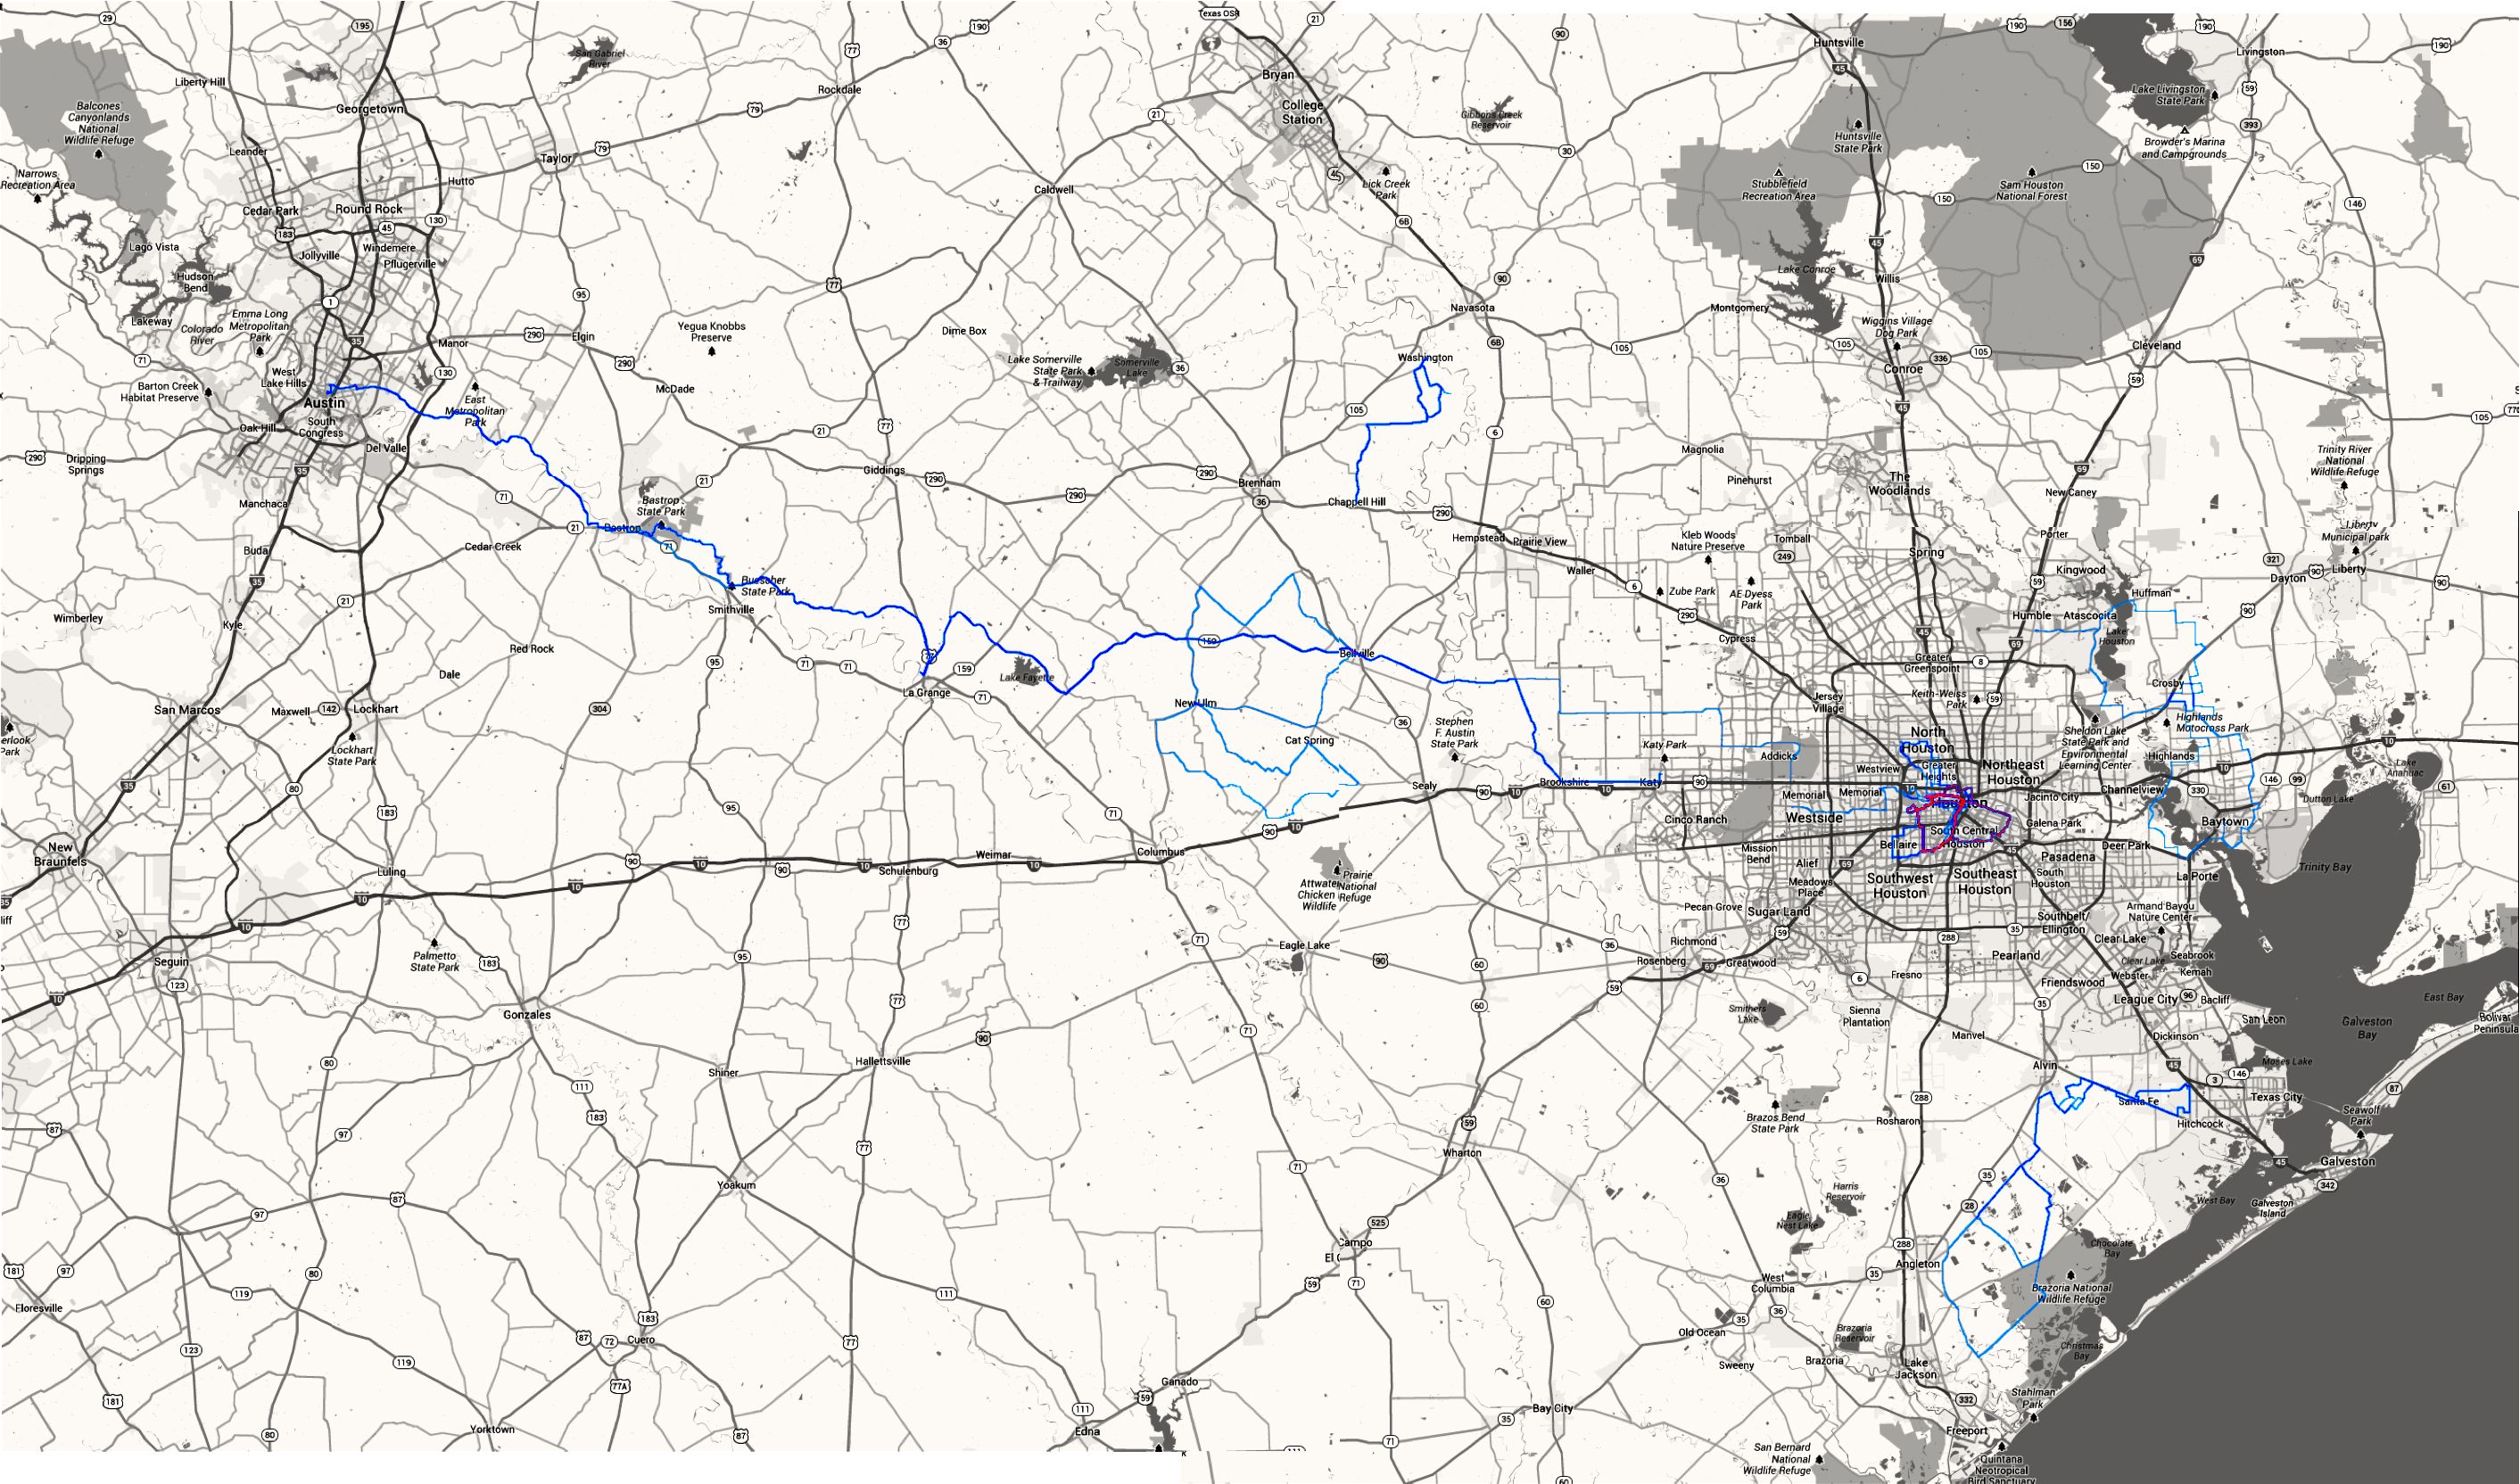
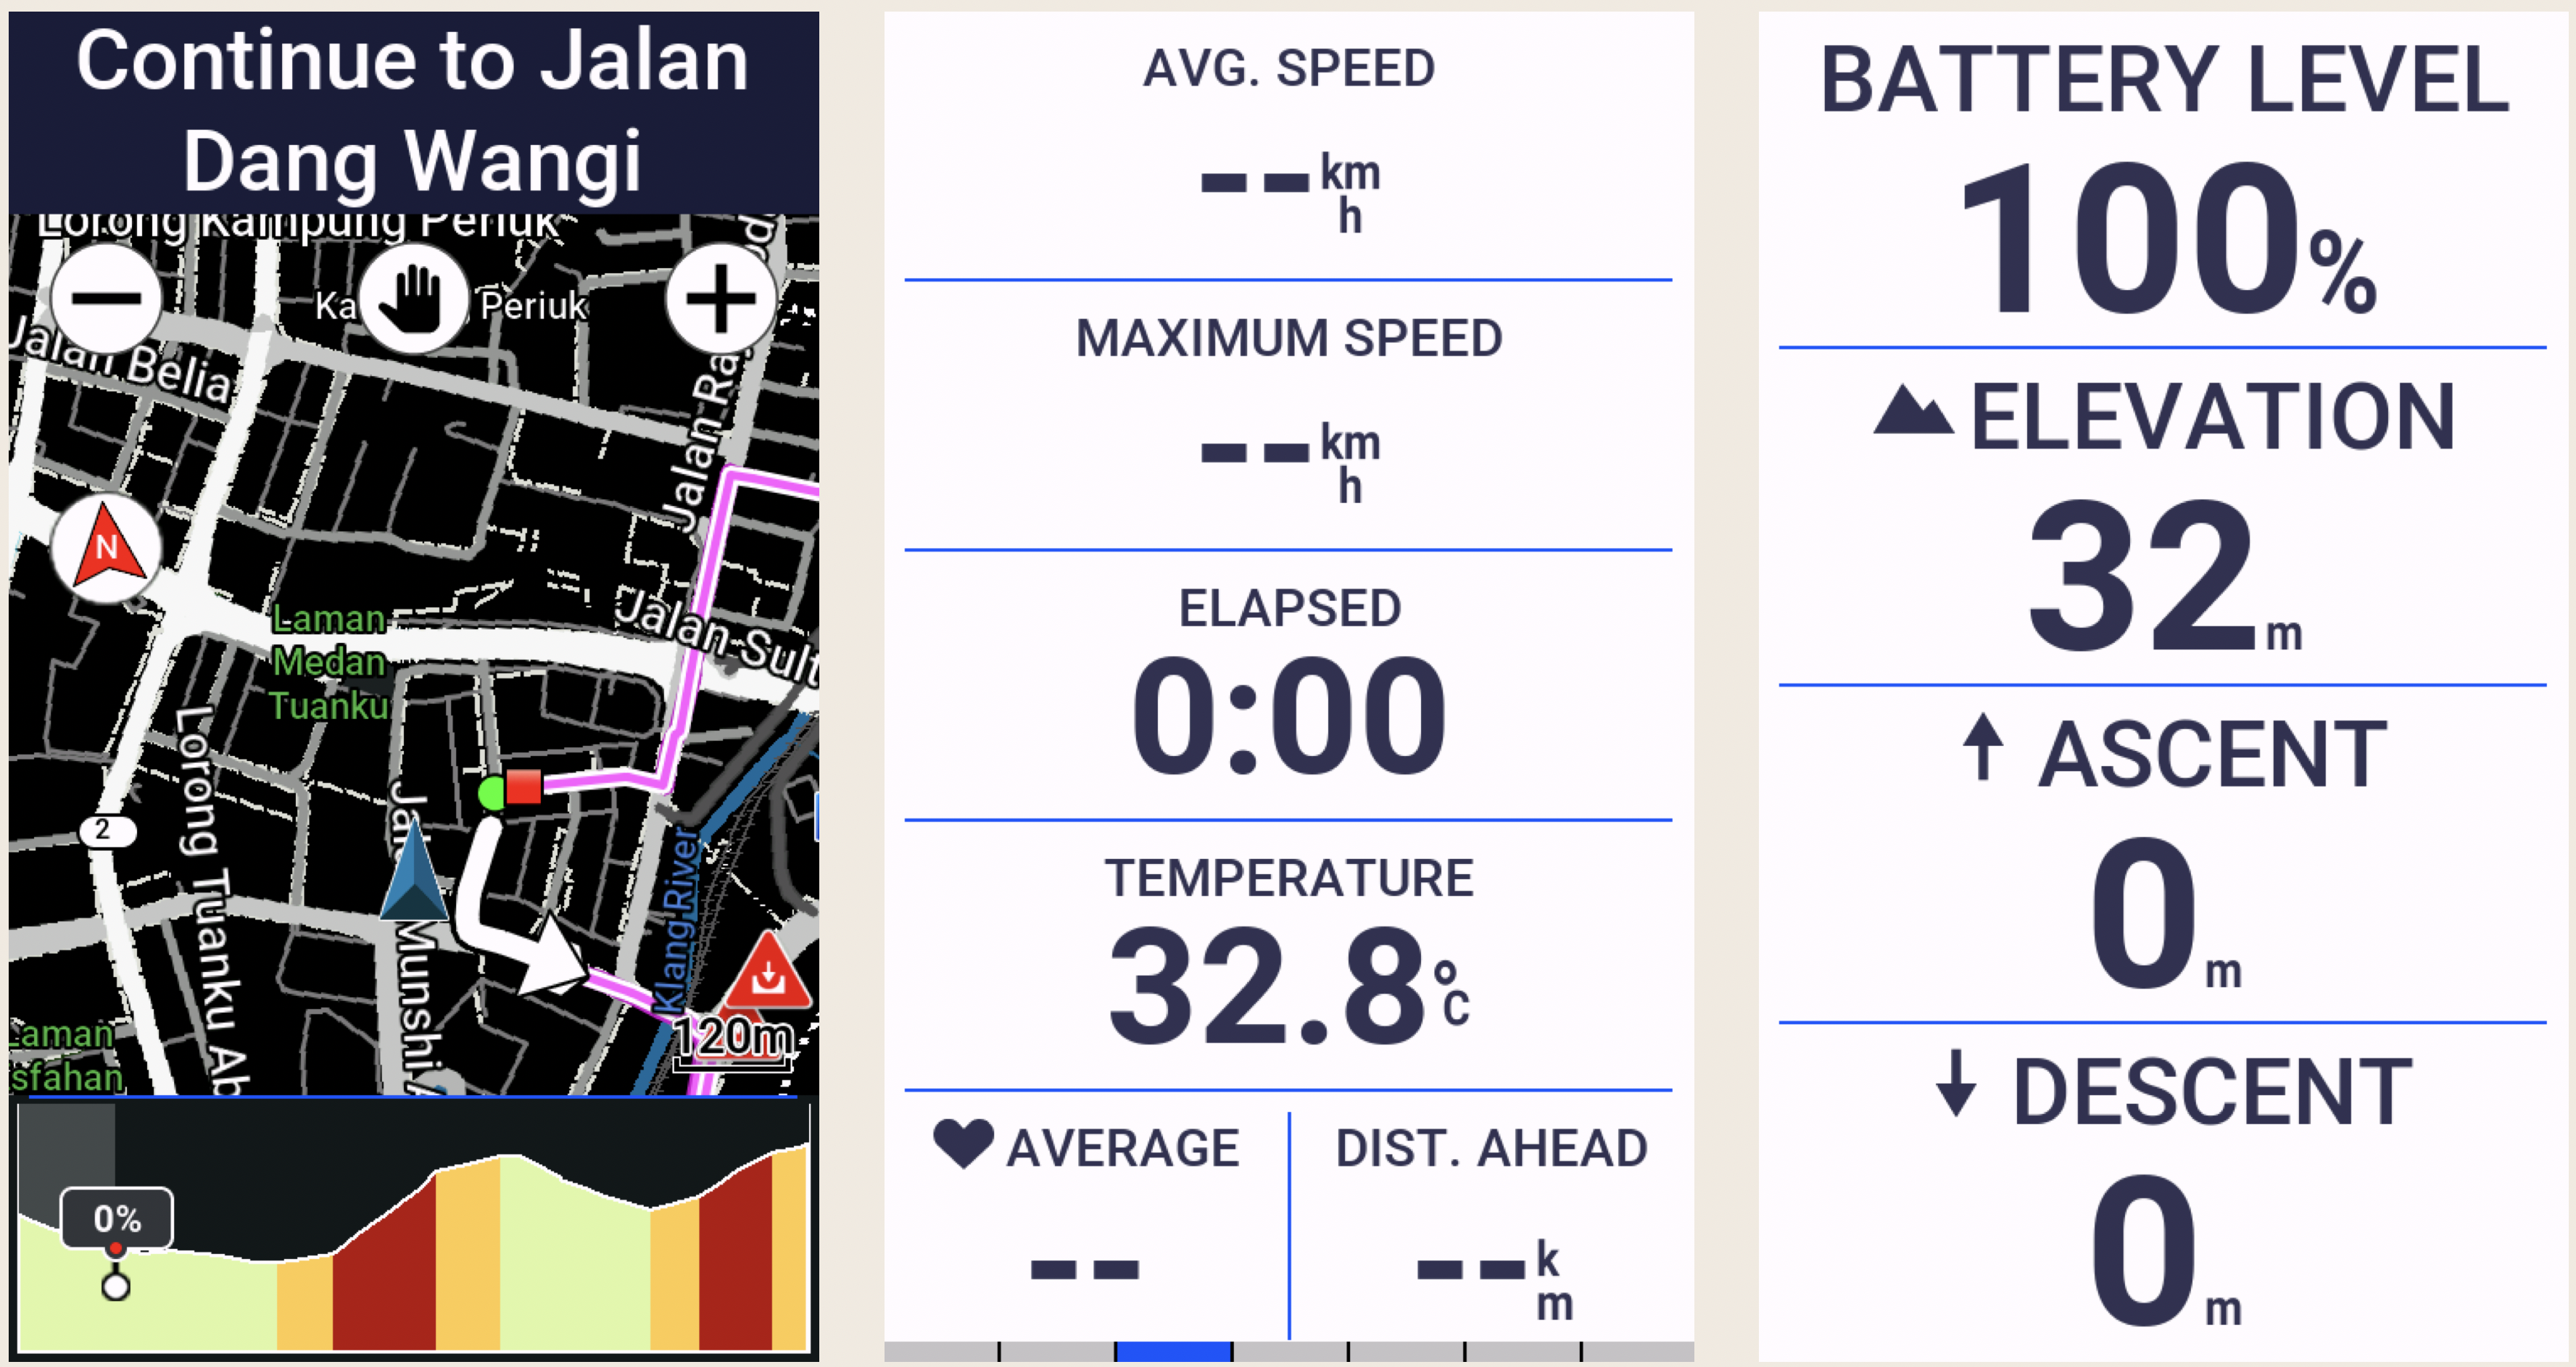
I swipe right from the data screen to access the Map screen when I want to see the layout of the roads around me.

I often follow pre-loaded routes or courses that I created using the Route Planner on ridewithgps.com. I upload these custom courses wirelessly to my Edge 1050. The Map screen below is in navigation mode. The course is highlighted and a directional arrow is displayed.

If the navigation screen is not already displayed while following a course, it will pop up automatically about 100 metres before an upcoming turn.

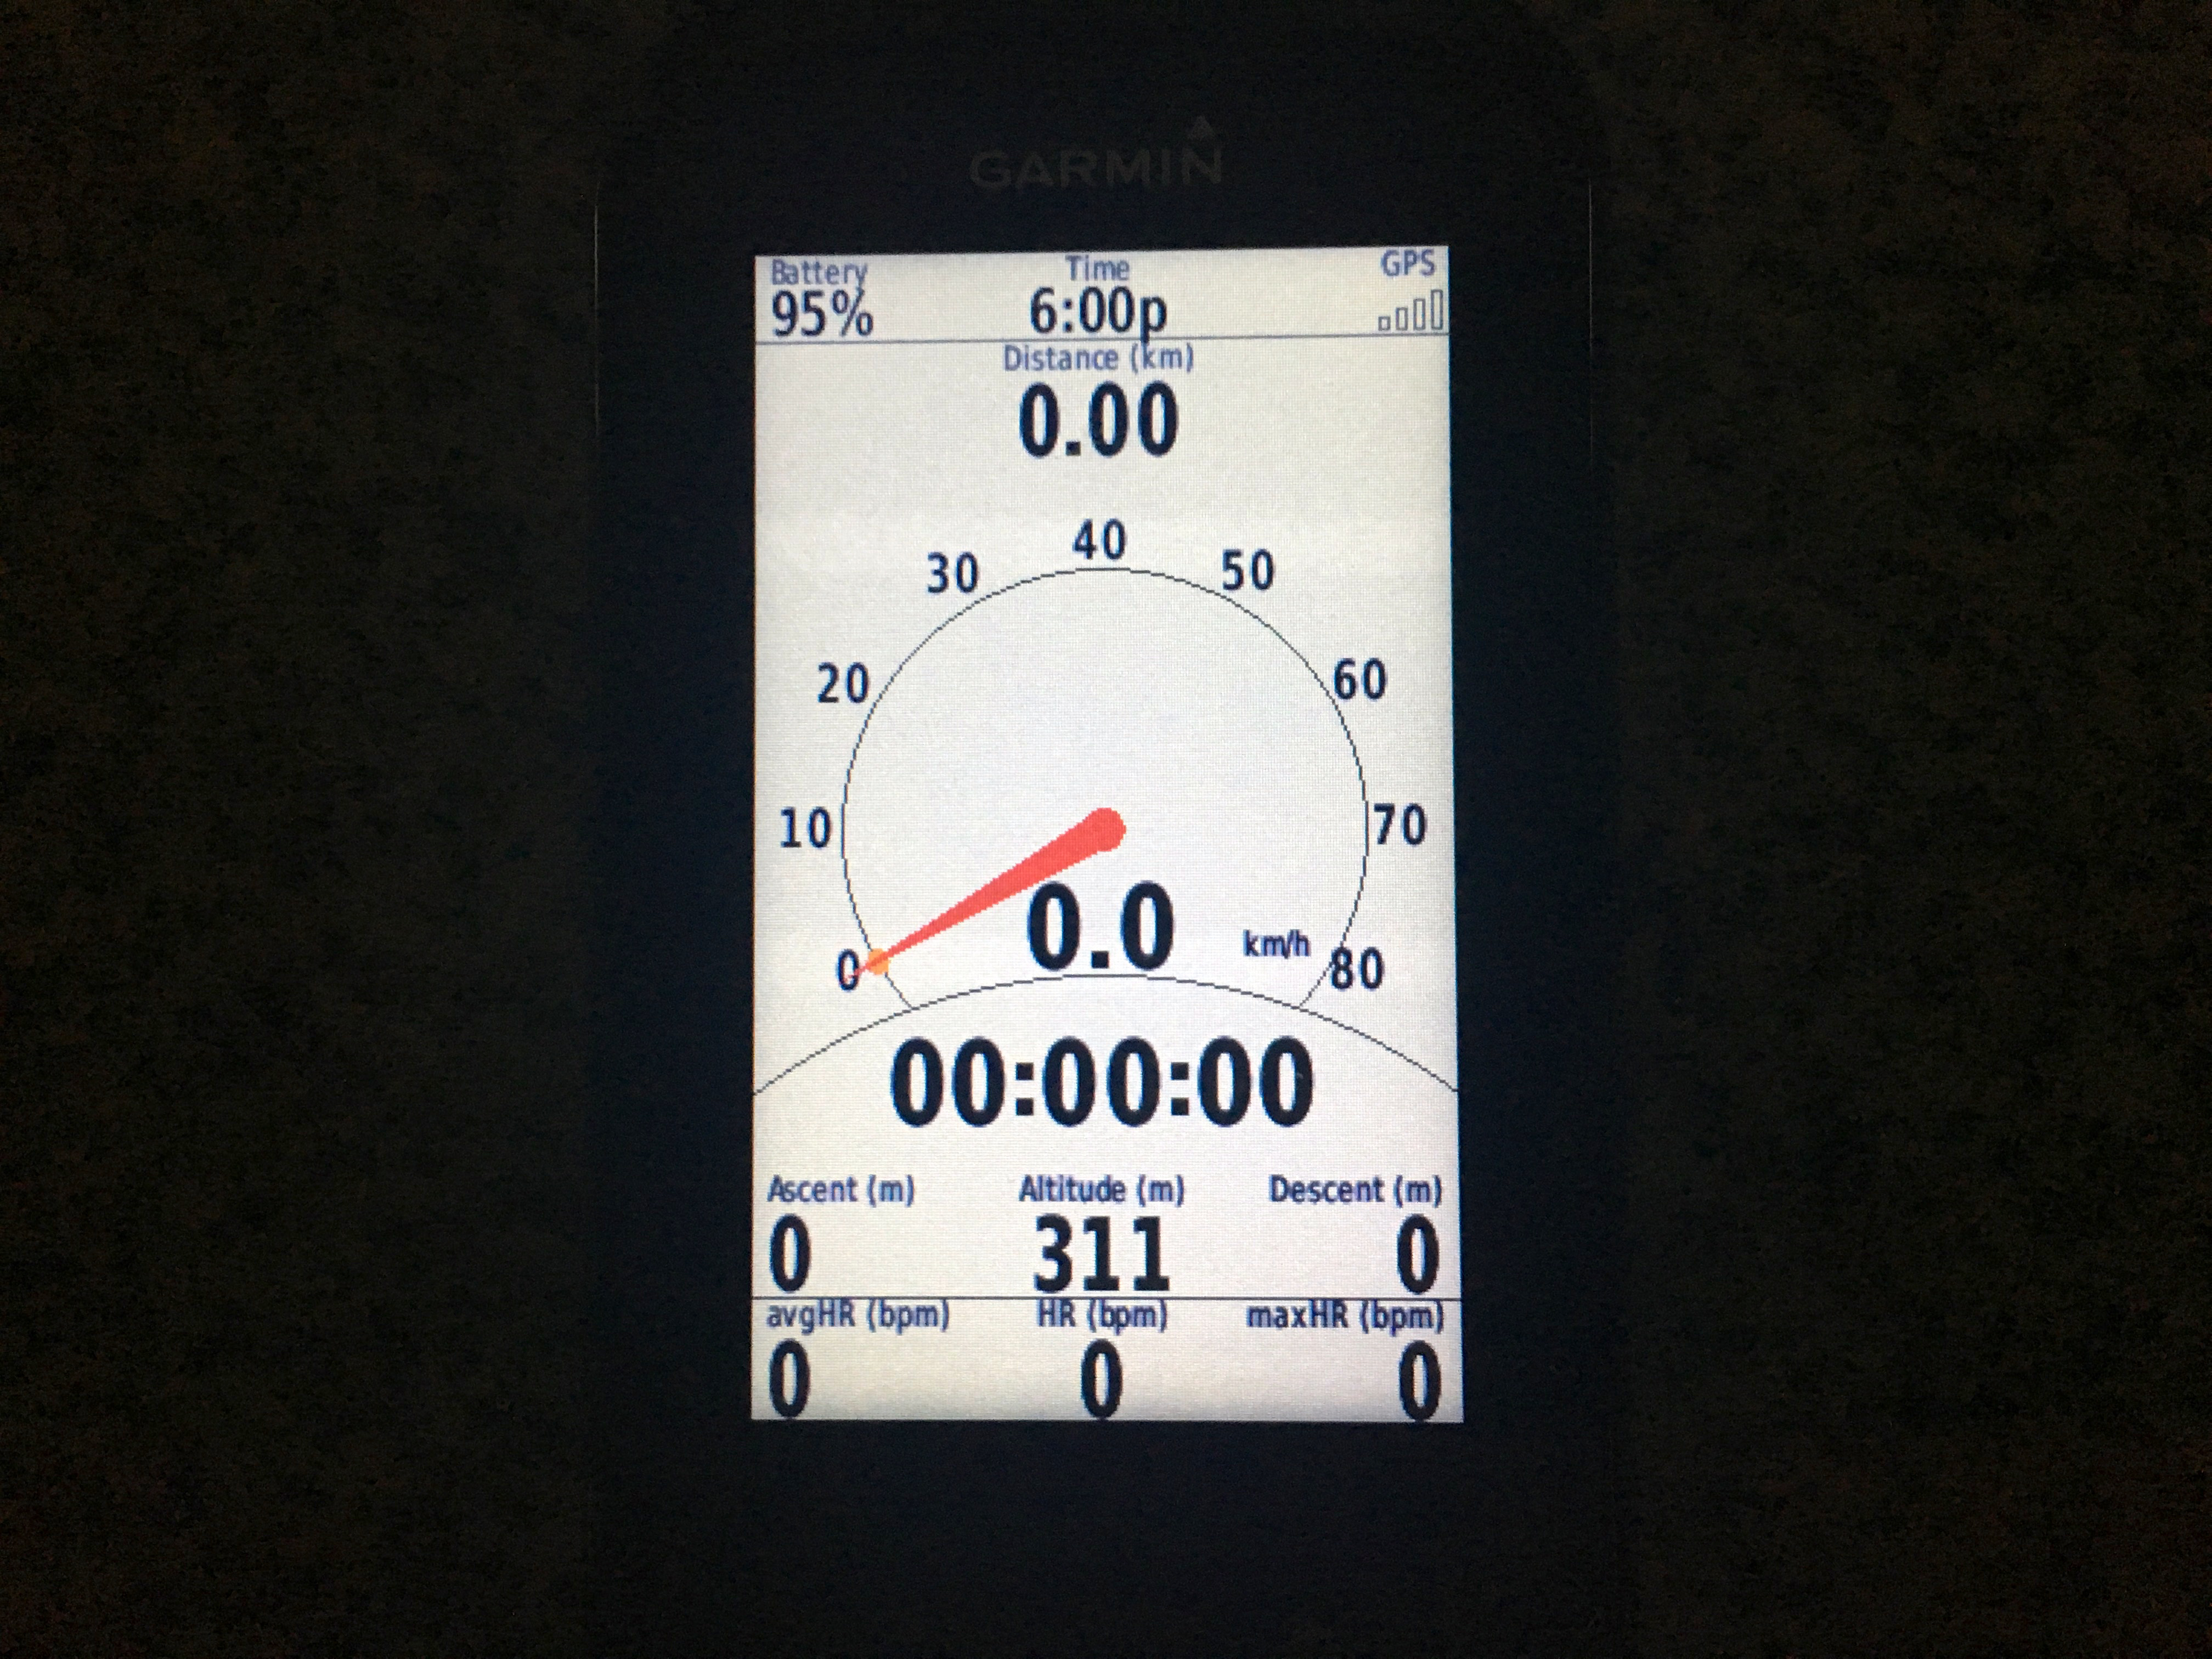
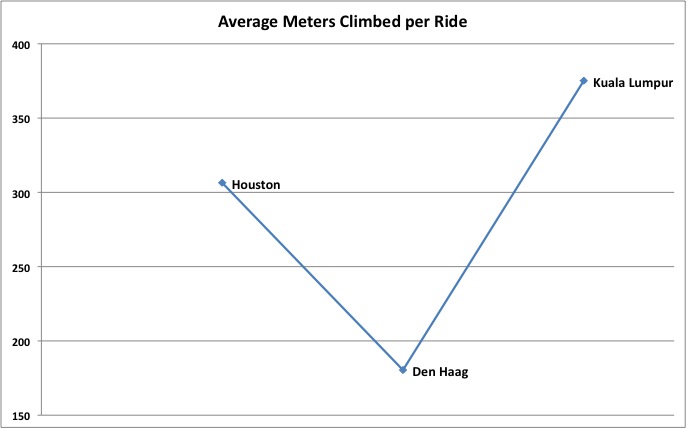
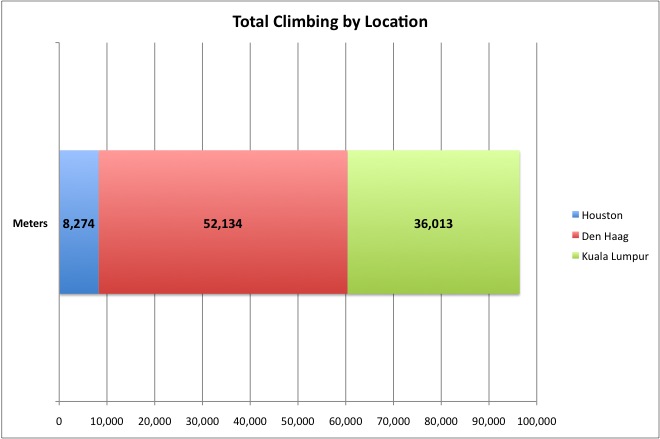
The other two data screens display data fields that I occasionally refer to. I most often want to know the current temperature and how much climbing I have done.

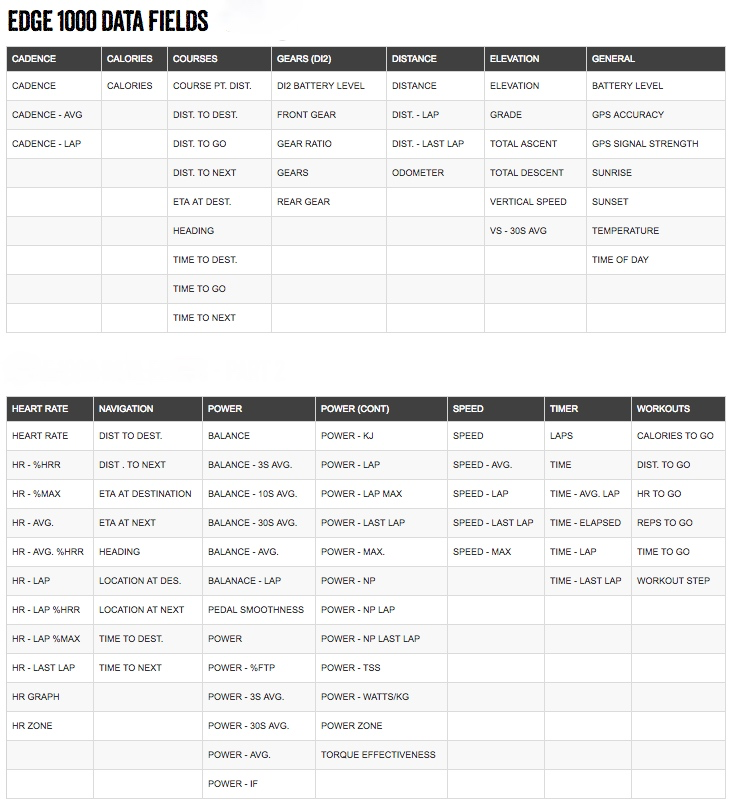
I mentioned that the data screens are customisable. You can create up to 10 custom data screens for each activity profile on an Edge 1050. Each of these screens can be customised to display up to 10 data fields by default. While 100 data fields per activity profile sounds like a lot, Garmin provides 151 data fields to choose from, across the following categories, in alphabetical order:

Data TypeNumber of FieldsExamples
Cadence3Average cadence, Lap cadence
Cycling Dynamics19Time seated, Time standing
eBike5Assist mode, Travel range
Elevation12Average ascent velocity, Grade
Gears8Di2 shift mode, Gear ratio
Graphical13Graphs showing Current Power Zone, Current Cadence Range
Heart Rate17% of Heart Rate Reserve, Heart Rate Zone
Lights4Light mode, Battery status
MTB Performance6Grit, Lap flow
Navigation14Next waypoint, Time to destination
Other11Temperature, Number of laps completed
Power32current power output, Average left/right power balance
Smart Trainer1Trainer controls
Speed5Average speed, Lap speed
Stamina4Current remaining stamina, Remaining potential stamina
Timer7Elapsed Time, Lap Time 
112Distance to go, Step Distance

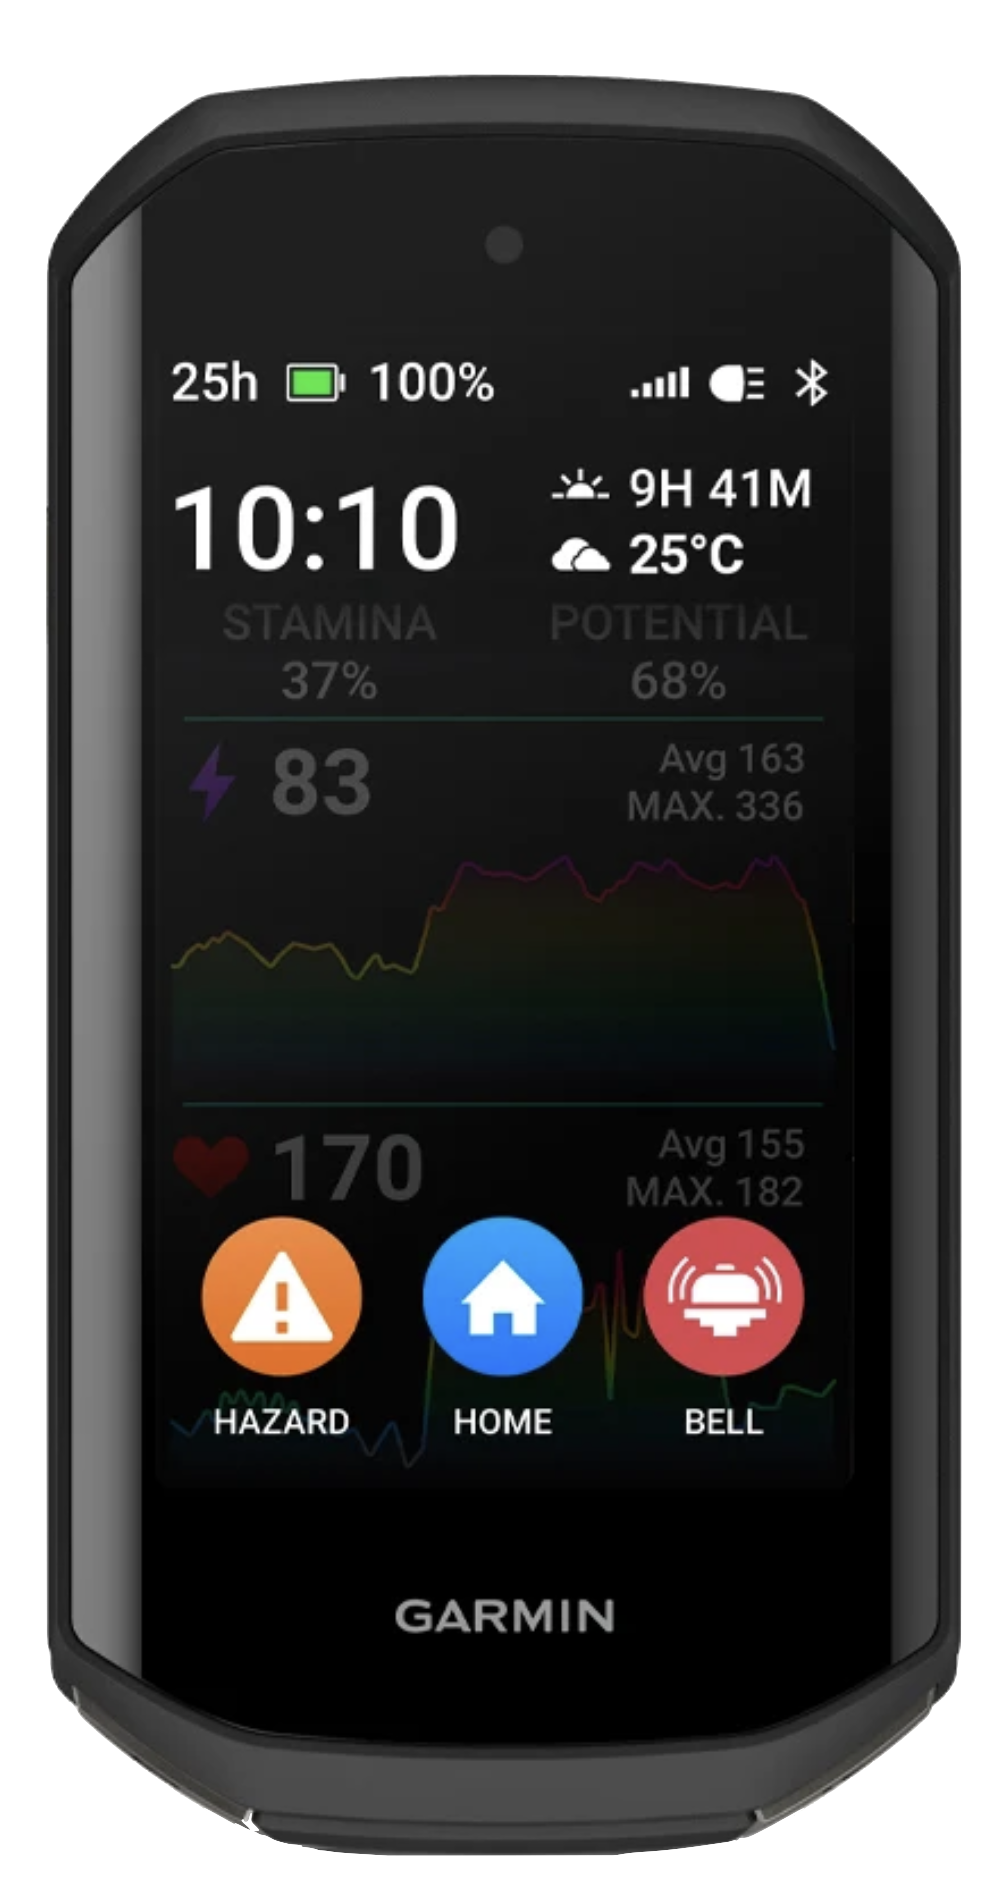
The Edge 1050 is capable of much more than I use it for. I don’t use features like Event Adaptive Training, Livetrack, Cycling Dynamics, and Garmin Group Ride Radio.

The features I do use work very well. Heart rate tracking, turn-by-turn navigation, Bluetooth, Wi-Fi and ANT+ connectivity, and the built-in speaker.

The bell, which can be rung from the Timer overlay screen, is an appealing new feature. The initial implementation of this feature was a bit clunky. It required tapping the screen to view the timer overlay, and then tapping the Bell icon in the bottom right corner of the main menu. It often took a few pokes to accurately hit the Bell icon.

The latest software update simplifies ringing the bell. Now, double-tapping on any data screen rings the bell. Oddly, double-tapping does not work on widget screens. Nevertheless, a welcome improvement that fixes the only niggle I had with my Edge 1050.

The thing everyone wants to read about in a cycling computer review is battery life. The Edge 1050 has a claimed 20-hour battery life when used with sensors connected, navigation running, etc. This stretches out to 30 hours with the screen brightness lowered to about 20-30%.

Enabling Battery Saver Mode, which lets you reduce backlighting, hide the map screen and allow the device to enter sleep mode during an activity, extends the claimed battery life to about 70 hours.

I highly recommend the Edge 1050. Some may quibble over the size and weight of this device. I want a large, bright and high-resolution screen on my cycling computer. The Edge 1050 gives me that display in a package that weighs less than a McDonald’s Big Mac.

In closing, one feature of the Edge 1050 that I hope to never use is the replaceable quarter-turn mount interface. I would rather not hit another wild boar.

AI-generated image courtesy of gemini.google.com

Cycle Computers

In May 2009 I bought my first bicycle.  A Trek FX7.5.  Before long the data geek in me was on the hunt for a cycle computer, so I could track speed and distance.  The gadget geek in me narrowed my search down to SpeedTrap compatible models.

SpeedTrap is the Trek / Bontrager name for the ANT+ 2.4 GHz digital wireless speed sensor that fits into a recess in the fork leg of the FX7.5 and other models in the Trek Range.  The Trek Incite 8i was my first cycle computer.

trek-incite-8i

Photograph courtesy of Evans Cycles

In January 2010 I got my first road bike.  I needed another cycle computer to go with it, because the Easton EC90 SLX fork on my new bike didn’t have a SpeedTrap mount.

By that time I was riding farther afield, and had already gotten lost a few times.  So a GPS-enabled device with mapping seemed like a good idea.  DC Rainmaker’s excellent in-depth review of the Garmin Edge 705 convinced me to break out my credit card and get one.

Garmin Edge 705

Fast forward to the end of 2016.  Cycle computer technology has, along with the technology in most consumer electronics, progressed by leaps and bounds since 2009. Today’s cycle computers have touch screens, are Bluetooth and wifi enabled, receive GLONASS as well as GPS signals, function as remote controls for certain lights and cameras, display missed phone call and text notifications, and do a host of other things that the Edge 705 is incapable of.

My Edge 705 is more than five years old.  It still works well, apart from the occasional spontaneous shut down, which I think I cured recently by doing a hard reset.  My Edge 705 does, however, show its vintage everytime I have to tether it to a PC via a USB cable to download ride data to Garmin Connect and Strava.  Newer devices do that wirelessly.

A more serious problem is ever-shortening battery life.  I had taken to carrying a power bank on longer rides.

The DC Rainmaker website was again my source for reviews of potential replacements for my Edge 705.  The Edge 820 is the latest Garmin offering, and DC Rainmaker’s preview post made it an appealing option.  Appealing, that is, until a trickle of negative comments from early buyers turned into a deluge.

garmin-edge-820

Photograph courtesy of Garmin

There were too many issues with the Edge 820 for my liking.  So I decided to buy a Garmin Edge 1000.  That model came out almost three years ago, but firmware updates have given the Edge 1000 most, if not all, of the capabilities of the Edge 820.  And three years should have been enough time for Garmin to flush all the bugs out of the Edge 1000.

garmin-edge-1000

Photograph courtesy of Cycle Solutions

Some people complain about the size of the Edge 1000.  At 58.0 x 112.0 x 20.0 mm (2.3″ x 4.4″ x 0.8″), it is not a svelte unit.  But those dimensions give the Edge 1000 a 30% larger display than the Edge 820, which in turn has a slightly bigger display than the Edge 705.  A key consideration, given the age of my eyes.

In November 2016 I went shopping online, and found the best deal at Bike Tires Direct.  34% off the RRP.  An Edge 1000 was soon on its way to me.

My excitement upon the unit’s arrival was quickly extinguished when it crashed and died during initial setup.  I was left with a paperweight.  A major bummer.

A visit to AECO Technologies, the authorized Garmin distributor for Malaysia, did not immediately solve the problem.  The unit would have to be sent to Taiwan for repair, at my expense.  Garmin does not provide a world-wide warranty for the Edge 1000, so I would have to foot the bill for shipping and repairs.

garmin-edge-1000-repair-cost


The alternative was for me to send the unit back to Bike Tires Direct in the United States, where the unit may have been repaired under warranty.  I decided to swallow the cost and work face-to-face with AECO Technologies folk, rather than communicate via emails and telephone calls to Bike Tires Direct and Garmin in the United States.

Anyway, the cost to send the unit to Taiwan for repair was slightly less than what I had saved via the discount I received from Bike Tires Direct.  That’s my story, and I’m sticking to it.

Six weeks later AECO called to say that the Edge 1000 was back.  It turned out to be a new unit, so there must have been something seriously wrong with the unit that failed.

Happily I had no problems setting up the replacement unit.  And it is working perfectly.

It is, however, going to take me some time to decide on my preferred layouts for all the data screens.  With the Edge 1000 you can have five data screens per activity profile, with each screen containing up to ten data fields.  You also have a map page, a compass page, an elevation chart page, the lap summary page, and the virtual partner page.  Each of those special pages allows you to specify two additional data fields on them.

And the list of data fields to choose from is extensive.

garmin-edge-1000-data-fields

Table courtesy of DC Rainmaker

If you set up the maximum of ten activity profiles, you could have up to fifty data screens and fifty special pages to manage.  With a total of six hundred data fields.  Talk about overload!

That is all too much for me.  I deleted all but one activity profile.  For the time being I have turned off two of the five data screens, and three of the five special pages.

If managing activity profiles doesn’t take up enough of your time, you can fritter more time away by going online to the Garmin Connect IQ Store.  You can spend hours scrolling through the Applications, Data Fields and Widgets available there.

This is my favourite data screen layout – for now anyway.  My EDGE is a customizable Data Field downloaded from the Connect IQ Store.  This one data field takes up an entire data screen, but it contains multiple data items which are user selectable.  The analog speedometer is particularly cool.

garmin-edge-1000-screen

A final note.

I own two Edge 705s (it’s a long story).  On one unit, some of the threaded plastic holes, where the screws holding the case together are inserted, have cracked.  So four of the six screws are missing.  Garmin no longer stocks spare parts for the Edge 705.  Not even replacement screws.  The advice from a technician at AECO is to use the damaged Edge 705 as the donor of spare parts, as needed, for the other unit.

Fortunately, replacement batteries for the Edge 705 are available from a number of online vendors.  I bought one from BatteryShip.com.  It was simple to install.

garmin-edge-705-replacement-battery

Photograph courtesy of BatteryShip

Now have a rejuvenated Edge 705 as a backup for my Edge 1000.  For which replacement batteries are also available.  Contrary to what AECO told me about the Edge 1000 battery being non-replaceable.

A final final note.

Don’t get me started on the 36 hour battery life of Bryton cycle computers.


Kilo Months

I started keeping track of my rides in January 2010.  I had a new road bike, and an even newer Garmin Edge 705 cycle computer.  Uploading the details to the Garmin Connect web site after every ride became standard practice.   That year I rode 3,173 kilometers.

The heat map below shows where I rode for the first six months of 2010.  The most-ridden routes are depicted in red.  Click on the heat map to open the image in a new window.  You will see that most of my kilometers were accrued on the West End Tuesday and Thursday evening rides, and the Sunday Taco rides through Houston.

2010 Heat Map

Heat Map courtesy of Strava

I had some big rides outside metro Houston:  The Humble Lions Club Ride, The Space Race, and the BP MS150.  But I didn’t have a kilo month, which is my term for riding more than 1,000 kilometers in a month.

In mid-2010 I moved with my biker chick to The Netherlands.  The excellent cycling infrastructure there gave me more opportunity to ride, albeit on my own as I didn’t connect with a cycling group until the following year.

I started riding with the Not Possibles in March 2011.  The Saturday and occasional weekday rides with them boosted the distance I rode in 2011 to 6,985 kilometers.  In 2012 that number increased to 11,054 kilometers.  Almost of those kilometers were around Den Haag, with the 2011 and 2012 Ronde van Vlaanderen sportives, and the 2012 UCI World Championships sportive in Belgium thrown in for good measure.

Heat map courtesy of Strave

Heat Map courtesy of Strave

I racked up my first kilo month in August 2011.  The fine summer weather allowed me to ride eighteen times that month for a total of 1,085 kilometers.

Somewhat surprisingly I didn’t have another kilo month until January 2012, when I rode 1,091 kilometers.  I then had four more kilo months that year.  March, and three in a row from June to August.  My Not Possibles friends and I had a good summer that year.  My biggest ever kilo month was in July, when I rode 1,718 kilometers.  I had the luxury of being able to go on twenty five rides that month.

In October 2012 my biker chick and I moved home to Kuala Lumpur.   My ride frequency and average distance dropped dramatically for some months before slowly increasing again.  So it took more than a year before I had another kilo month, in September 2013.  Helped by five rides of at least 100 kilometers each.

My 2013 heat map looks a lot like my 2010 Houston heat map in that most of my rides are limited to a couple of routes.  Int his case KESAS and the Guthrie Corridor Expressway, with Putrajya and Genting Sempah thrown in for variety.  Scattered around the map are the one-off events that I rode in Johor Bahru, Kuala Terengganu, Kuantan and Penang,  My Racun buddies and I also rode to Fraser’s Hill, and I joined Dave Ern on a ride to Cameron Highlands.  You can also read about the Bike X and Broga 116 rides.

Heat Map courtesy of Strava

Heat Map courtesy of Strava

It looks like I will ride about 7,300 kilometers in 2013.  And perhaps have another kilo month this quarter.  Garmin Connect will reveal all.

By the Numbers

I bought a Garmin Edge 705 when my first road bike was delivered.  I used it initially to record where and how far I had ridden.  You can download the details of your rides to a Garmin website called Garmin Connect.  Among other things Garmin Connect displays maps showing exactly where you went on your ride, or run or hike.  It was fun to be able to show my biker chick where I had gone on my bike.

Garmin Edge 705

When I started doing longer rides with the West End group I used the speed display to help me keep a consistent pace when I took my turns at the front of the peloton.  I hadn’t bothered to install the speed sensor, or the cadence sensor for that matter.  I depended on the speed data calculated by the GPS chip. I used the heart rate monitor out of a casual interest in what my pulse rate was rather than as a training aid.

I rode solo during my first year in the Netherlands.  The “Back To Start” function came in useful on more than one occasion.  One canal, or windmill, 0r field of cows looks much like another.  No help when you are lost and 40 km / 25 mi from home.

The heart rate monitor saw some serious use once I started doing organised rides (by that I mean longer and faster than I was used to) with the Not Possibles.  By that time I had a rough idea of what my heart rate zones were.  Tracking my pulse rate helped me manage my effort so that I didn’t wear myself out before the end of the ride.

Since 31st January 2010 I have been transferring all my rides to Garmin Connect.  There are 412 rides in my account.  I took a look at all that data today.

The first set of numbers shows how much ground I have covered on my bicycles in three and a half years.  Enough to get me from Kuala Lumpur to Warsaw and back.  24,448 km / 15,191 mi.

Total KM

68% of my time since January 2010 has been spent in the Netherlands.  It follows that most of that pedaling was amongst windmills and canals.

What surprised me was the average length of my rides.

Ave KM

I hadn’t expected the average Houston ride to be slightly longer than the average Den Haag ride.  I must have done more 20 to 30 km / 12 to 18 mi rides in Holland than I thought.

I am not surprised that the average ride length has dropped in Kuala Lumpur.  I do the Damansara Heights ride fairly regularly.  That one never exceeds 16 km / 10 mi.  The Putrajaya ride tops out at just over 20 km / 12 mi.

The shorter rides in Kuala Lumpur are somewhat made up for by more frequent rides as compared to Houston and Den Haag.

Ride Frequency

I rode on average every 4 days in Houston.  In Kuala Lumpur it is every 2.6 days.  I put that down to linking up with a group of cyclists as soon as I arrived in Kuala Lumpur.  There are four or five groups rides per week in Kuala Lumpur.  There were three weekly group rides in Houston, and only one per week in Den Haag.

Elevation data is suspect.  The barometric altimeter in the Edge 705 is not accurate if it is not calibrated before every ride..  I don’t bother.  Websites like Strava and Ride With GPS allow users to overwrite GPS elevation data with data calculated using a variety of data sources and algorithms.  This “corrected” elevation data is often, but not always, more reliable.

Nevertheless, it is interesting to look at elevation data for comparative reasons.  I did expect the data to show that rides in Kuala Lumpur require the most climbing.

Ave Climbing

The average for Houston surprised me at first, but upon reflection it makes sense.  Chappell Hill was within easy reach by car.  We rode quite a bit there.  Training for the hills of Austin that were to come in the BP MS150!

The Netherlands is as flat as advertised.  Cyclists are only partly joking when they say they go to a multi-storey car park to practice hill climbs.  The Dutch hide some elevation in the dunes along the coast but that is about it.  The climbing average for Den Haag is padded by a few visits to Limburg and Belgium, where there are some real hills.

Regular readers will already know that I was startled by the degree of climbing required when riding around Kuala Lumpur.

Total Climbing

It won’t be long before I surpass the number of meters I climbed whilst in the low country.

The final number is also for guidance only.  You know what I mean if you have ever looked at the “calories burned” numbers that exercise machines produce.

Bic Macs

However I won’t let details get in the way of feeling pleased with myself for burning the caloric equivalent of 1,802 Big Macs.

A milestone ahead, pardon the pun, is 25,000 km / 15,534 mi total distance.  I’ll be beyond 1,000,000 calories burned by then.  I wonder what number that would be in nasi lemak terms?

Where Do I Go From Here?

The Netherlands is criss-crossed with a network of dedicated bike paths.  Every part of the country is accessible by bicycle.  If your bucket list includes riding every path, you would have to cycle about 29,000 km.  There isn’t anywhere that you can’t cycle to.  It was clear from my “Bicycling 101” class that all I had to do was wheel my bike outside the front door, choose a direction and start pedalling.  And be sure to avoid the 53 ways to pick up a road rules fine.

I used a Garmin Edge 705 GPS cycle computer in Houston.  It came with a detailed road map and points of interest.  So I could use the unit to navigate with exact, turn-by-turn directions to any address or intersection.  I used my Edge more for tracking where I had been rather than for planning routes.  Nevertheless I installed a map of the Netherlands.  If nothing else I would be able to see on the screen exactly where I was hopelessly lost.

The best thing about the unit is that when maps and sign posts fail, it will get me back to where I began my ride.

Garmin Edge 705

I quickly discovered that I would have little use for the navigation functions on my Edge 705 in the Netherlands.  The 29,000 km of bike paths are sign posted.  And since the Dutch are nothing if not meticulous, they didn’t stop at just one sign post system.  They have four that I know of.

The first type of sign post is much like what you would see on normal roads.  Signs point in the direction of cities and towns, listing the distance to each.  A more distant major destination is listed on the bottom of each ‘finger’, and the closer, minor destination is shown on the top.  Once a destination is listed, every subsequent sign along the route will list that destination until you reach it.

The sign posts for cyclists feature red or green lettering on a white background.  The options shown in green are less-direct alternatives that offer scenic routes through the Dutch countryside.

Maassluis to Hoek van Holland Ride 02

The second type of sign post for cyclists sits low to the ground and is mushroom-shaped.  These signs are located in more rural areas where the bike paths intersect away from roads.  Each of the four sides has direction and distance information for destinations nearby.  The sign below with the red lettering on a white background is a newer one.  The older style has the same shape but features black lettering on a white background.

Mushroom

The third system of providing directions for cyclists is the Bicycle Node Network (Fietsknooppuntennetwerk).  Each junction on the cycling path network has been given a unique one or two-digit number.  You need a map showing all the ‘knooppunten’ or nodes.  These maps also list the distance between nodes so you can work out how far away your destination is.

Planning a route from the starting node to the ending node is a simple matter of making a list of all the intermediate nodes that you want to cycle through.  There is a list of online route planners at fietsen.123.nl to help with this.

Knoppunkt Map 2

Each junction or node is marked with a sign showing the node number and a map of the immediate area.

Knoppunkt Map

Signs like this show you which way to go to the next closest nodes.

The fourth system is a network of long-distance, or LF (Lange afstands Fietsnetwerk) routes.  There are currently 30 LF routes covering some 4,500 km in total.  These routes include the LF 1 North Sea Route, which starts in the south near Sluis at the Belgian border, and continues up the coast to Den Helder in the north.  The Not Possibles often cover sections of this route between Hoek van Holland and Zandvoort during their Saturday morning rides.

The LF routes are marked in both directions with rectangular white signs with green lettering.  In this case the sign pointing in the opposite direction reads “LF 1a”.

LF1

With few exceptions the various wayfinding systems on the bike paths served me well.  I would pick a destination and let the signs show me the way.  Confident that if I did get lost, which happened on a few occasions, I could always access the menu on my Edge 705 and select “Back to Start”.