
A Bicycling Magazine article titled The Average Cycling Distance By Age, According to Popular Cycling Apps popped up in one of my newsfeeds the other day. The article lists, among other things, how far users of Ride with GPS have cycled per ride over the past five years. Articles like this are catnip for me. I have to look up my average distance per ride data to see how I compare.
I use a Garmin cycling computer to record my ride data. The Garmin Connect software sends that data to Strava. Apparently, if it is not on Strava, the ride didn’t happen! Strava is an excellent social-purpose app, but extracting data from Strava for analysis is not straightforward. I use VeloViewer for a month-by-month or annual view of my ride data.
Veloviewer presents summary data in several ways. This Infographic shows the Total Ride Distance for a chosen year. I use Active Days as the proxy for the number of rides I did that year. You can see how much less I cycled last year compared to 2019.
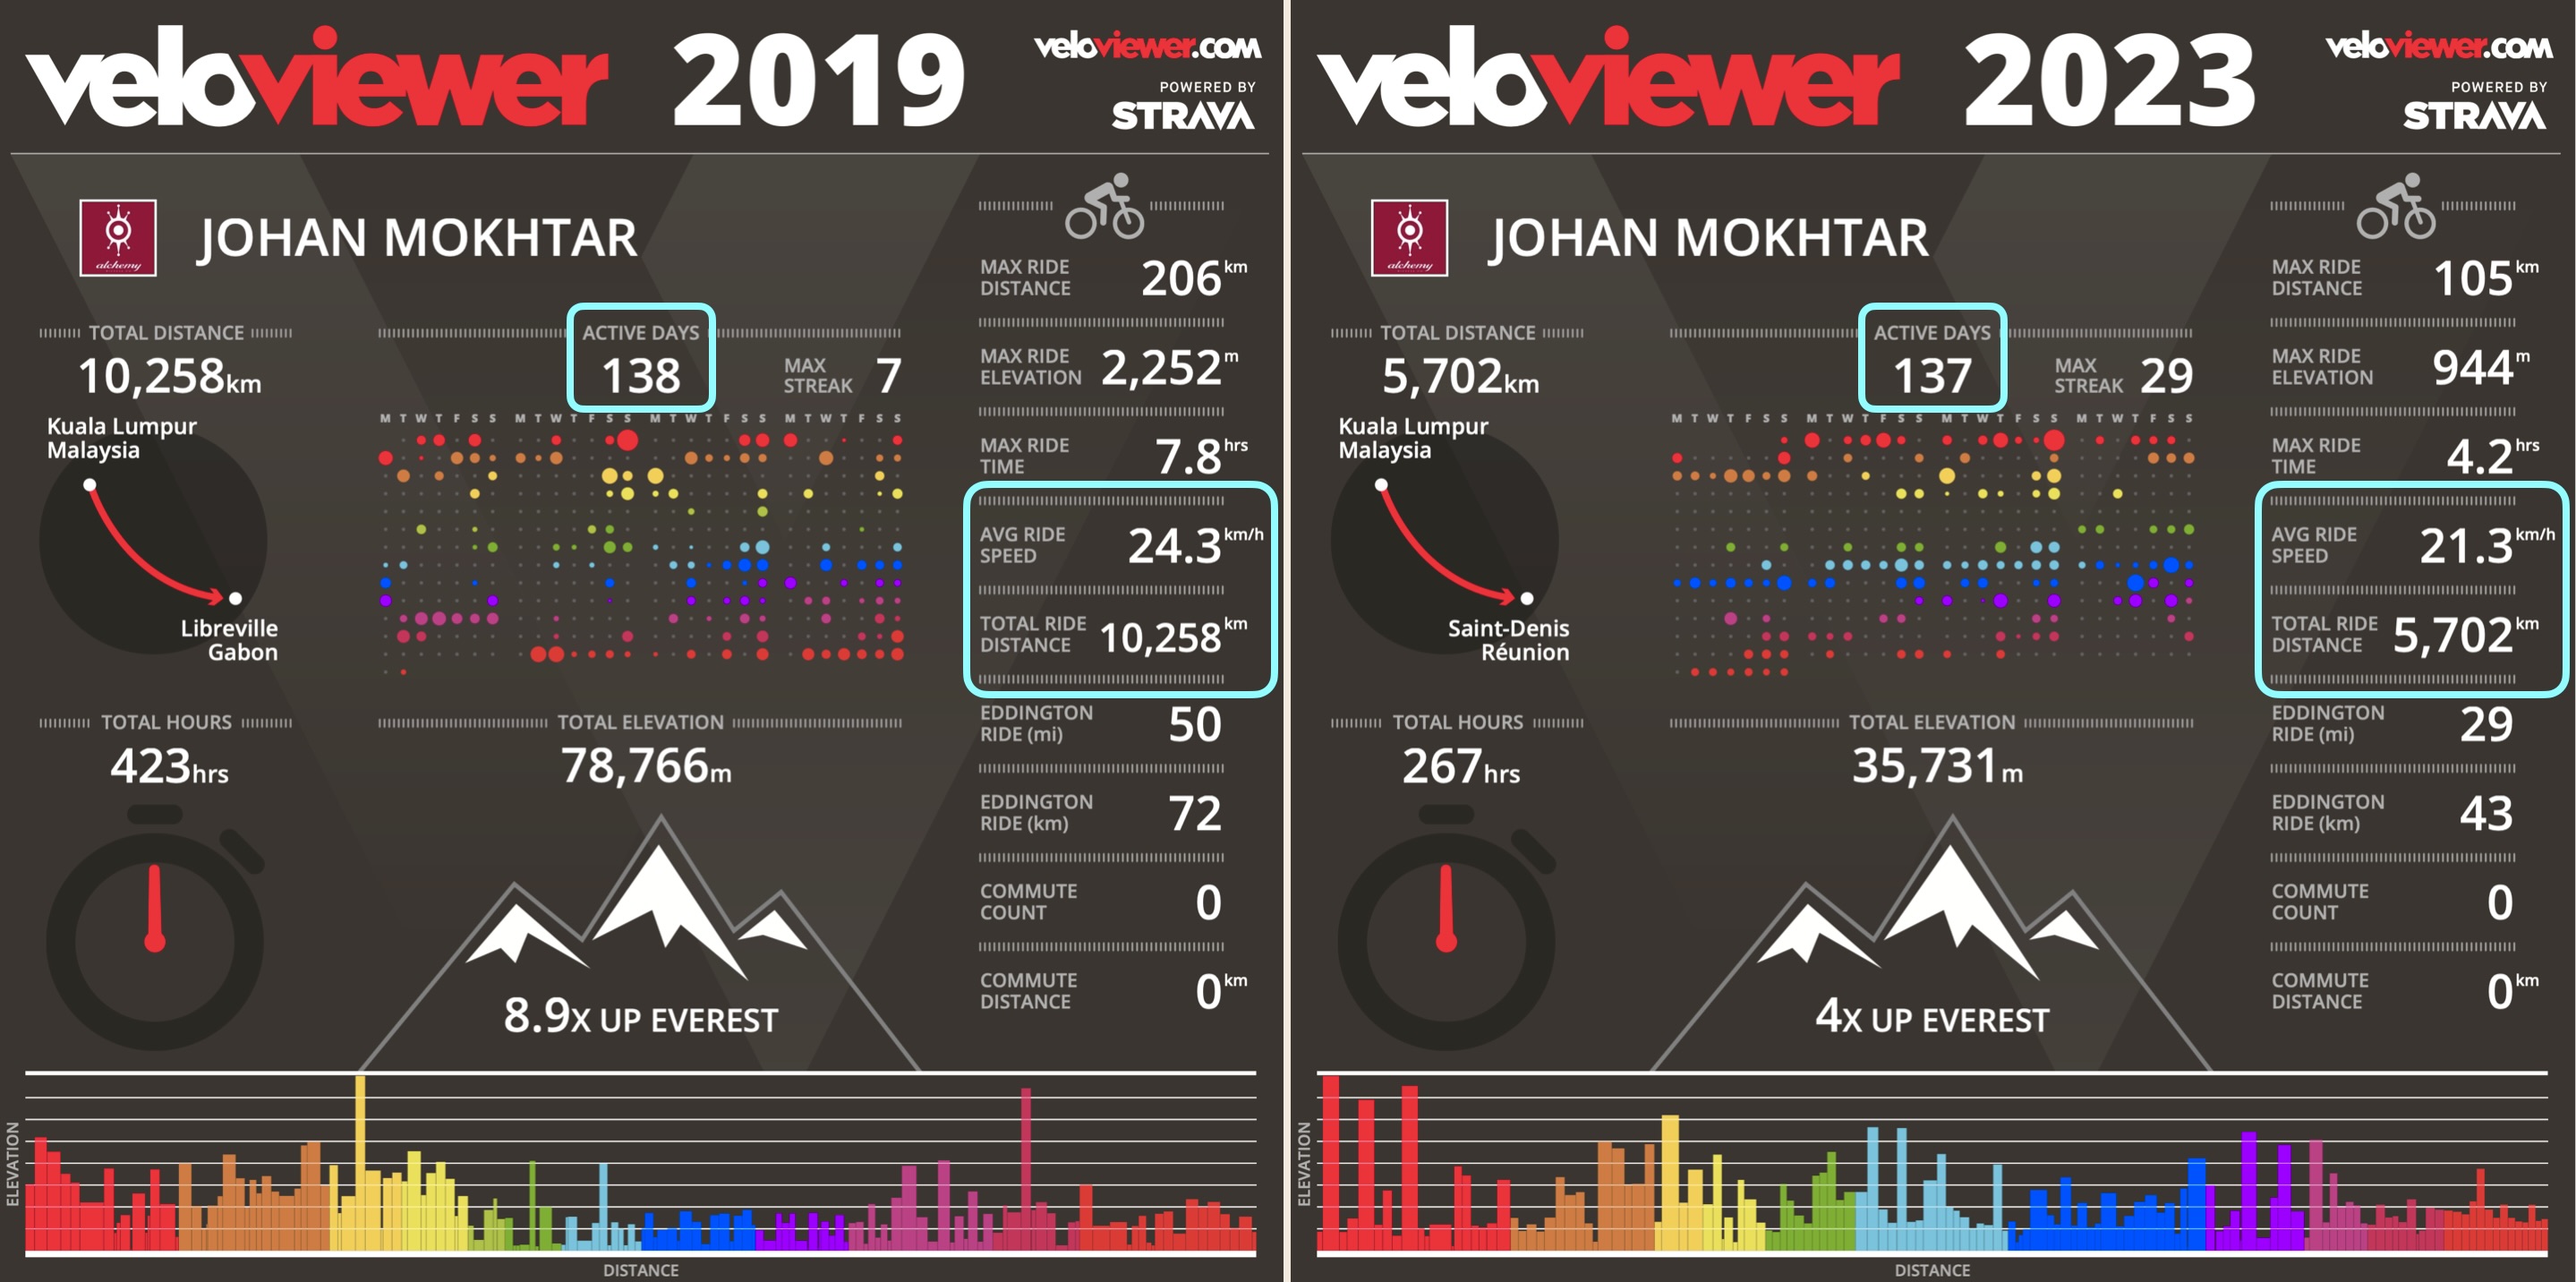
The Infographics also show Average Ride Speed. That led to looking up average cycling speed by age. I found that data on trainerroad.com in an article titled How to Improve Your Speed & Get Faster at Cycling: 3 Strategies to Improve Your Average Speed. The speed data there was for 2023.
This chart combines the average distance data from the Bicycling Magazine article and the average speed data from the TrainerRoad article.

I compare well to the average distance for my age group. I was 62 in 2109 so I have been in the 60-69 bracket for the past five years. My five-year average distance per ride is 55.10 km
My average distance per ride is dropping by the year though. That figure so far in 2024 is 40.98 km. Still reasonably above the 35.20 km average distance per ride for my age group in the Ride with GPS data.

I don’t compare so well against the Trainer Road average speed per ride data. My age group averaged 22.6 kph per ride in 2023. I averaged 21.3 kph. Like my average distance, my average speed has been falling since 2019.
My five-year average speed per ride is 22.7 kph. A whisker above the 2023 Trainer Road speed-per-ride average for my age group. I suspect the Trainer Road data has stayed consistent over the years. I have fallen behind that average since 2021.

I get an ego boost when I equal or exceed performance statistics like these.

I am also reminded that I have a lot to be grateful for. Being healthy and fit enough to ride my bicycle is a blessing. In an average way or otherwise.

Addendum
As I wrote this post I felt that I had covered this ground recently. Sure enough, in this post μ = Sum of Values ÷ Total Number of Values* I compared my 2023 distance and speed averages to the figures published in the Strava Year In Sport Trend Report: Insights on the World of Exercise.
In the Strava report the age groups are separated by generation rather than by ten-year periods. I look quite good against the other Boomers in that Strava report.
Ego boost!

Very interesting on how according to that data, the average distance trends upwards with age, while the average speed trends down slightly. As you get older (retired?) you have more time to ride and enjoy life at a more cruisy pace? 🙂
Hello, tempocyclist.
That is true in my case. I can ride my bicycle any day of the week and whenever the weather allows.
The desire to ride fast does ebb as the power-to-weight ratio falls 😄.
Are you still in Oz?
Yep still out here in Oz. Probably will be for the foreseeable future at least! I’m lucky enough to have a fairly flexible job and I work from home, so I can often sneak in a weekday ride if the weather is good. Still, I’d always like more time! 😅 Keep those pedals turning!
Tasmania?